 Trace Elements in West Virginia Coals
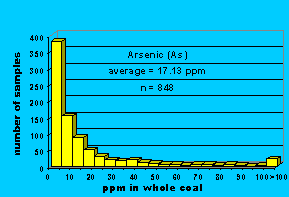
 Elemental Distribution (Histogram) Example
The statistical distribution
(histogram) of each trace element is included to convey the actual distribution
of trace element values in West Virginia coals. These charts  show
the trends of the trace element in ppm on a whole
coal basis for all coal samples. The average trace element value
in ppm is given as well as the number of samples determined. Some trace
elements display a somewhat normal distribution, while other element distributions
are highly skewed. Arsenic, for example, averages 17.13 ppm in 848 samples,
but is less than 5 ppm in 363 samples, and less than 10 ppm in 510 samples
with a small number of samples containing very high (>100 ppm) arsenic
concentrations.
 Trace Elements in West Virginia Coals
 Trace Elements in West Virginia Coals
 show
the trends of the trace element in ppm on a whole
coal basis for all coal samples. The average trace element value
in ppm is given as well as the number of samples determined. Some trace
elements display a somewhat normal distribution, while other element distributions
are highly skewed. Arsenic, for example, averages 17.13 ppm in 848 samples,
but is less than 5 ppm in 363 samples, and less than 10 ppm in 510 samples
with a small number of samples containing very high (>100 ppm) arsenic
concentrations.