 Geoscience Education in the Mountain State,
CATS Earth Science Connections Telecourse
Geoscience Education in the Mountain State,
CATS Earth Science Connections - Fall 1997
This distance education course is being offered through the West Virginia Department of Education. It is one portion of Project CATS, a National Science Foundation-funded statewide program designed to enhance the ability of all West Virginia science teachers. Earth Science Connections is offered every Wednesday evening from 6:30 - 9:30 p.m. The course is taught by a team of master teachers acting as enhanced downlink site facilitators. Each facilitator has received training and materials for use at their site and is free to conduct the operations of their site to best meet the needs of their participants. Lead instructor for the course is Dr. Robert E. Behling (Dr. Bob) of the Geology and Geography Department of West Virginia University. Materials from the weekly telecasts and exploratory activities will be posted at this site. Students enrolled in the class may request information by e-mail from the WVGES Education Specialist.
Employing a learning cycle model, each weekly Earth Science Connections Telecourse class is divided into three components: a 90-minute topic exploratory session, a 60-minute on-air concept introduction broadcast, and a 30-minute concept application and review session. Each exploratory session provides participants with a variety of individual, collaborative, and collective activities accentuating creative thinking and active manipulation of materials. The on-air broadcast expands upon ideas developed during the exploratory session. Application of new ideas and knowledge occurs during the remaining 30 minutes. Participant application of accumulated weekly content is demonstrated during several local and regional field experiences. The continuously open audio bridge encourages interaction among sites while allowing for immediate response to questions and comments.
Week 1: September 10, 1997 - INTRODUCTION
Exploratory Activity: Registration, pre-test, and participants' creation of their own list and discussion of facilitator earth science content list.
During pre-broadcast planning and training sessions, each facilitator was asked to compose a list of earth science topics they thought their students should grasp. The list below summarizes the result of this exercise. These ideas provided course designers with themes to be emphasized.
Earth Science topics which students must understand (in no order of preference):
Participants at each site were asked to construct a similar list and discuss it before the on-air broadcast.
Televised Broadcast: COURSE INTRODUCTION
Week 2: September 17, 1997 - EARTH MATERIALS
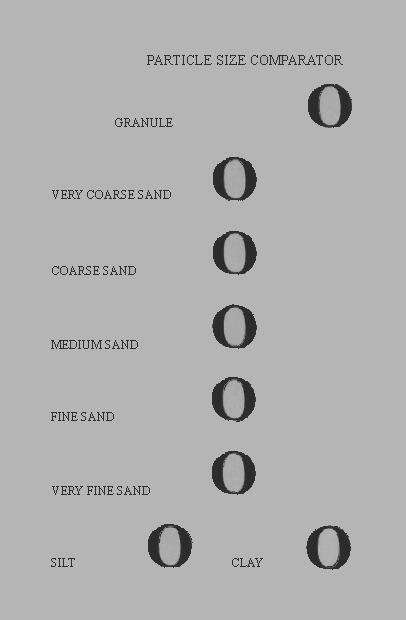
Exploratory Activity: Making Grain Size Comparators
 Using the supplied sediments, white glue, and comparator cards, make a classroom set of
grain size comparators for your student to use. When used with students, they should begin to
understand:
Using the supplied sediments, white glue, and comparator cards, make a classroom set of
grain size comparators for your student to use. When used with students, they should begin to
understand:
Televised Content Broadcast: EARTH MATERIALS
Televised Demonstration: Remember the cylinder filled with clay, silt, and sand-sized particles and water? After shaking, predict the results. Settling and separation by grain size will be noticed. Allow the cylinder to sit for 30 minutes or so. Note that the clay minerals create a "gel" on top of the sand. Tilt the tube from side to side and the gel will "flow" in the cylinder. This principle is called "flocculation" and is the basis for early stages of water purification. When we analyze particle size in the lab, we do not want clay minerals to flocculate. A bit of sodium hexametaphosphate (aka, Calgon!) takes care of clay minerals that otherwise would "seek partners" in the suspension. Experiment by using a pinch of household dishwashing powder in your tube, shake it, and let it sit for a while. Add bigger "pinches." What happens?
Weekly assignment: What Intsructional Goals and Objectives (IGO) did tonight's topic address? Instructions for the weekly IGO assignment:
Background information:
Sieves are used for sorting particle sizes (big to small, these are: Granule, Very Coarse Sand,
Coarse Sand, Medium Sand, Fine Sand, and Very Fine Sand). Although silt and clay are
available, these sizes must be separated in water as done in the water/sediment cylinder.
These particles are commonly called "grains." You will hear "grain size" mentioned a lot in
 class. Sand, made primarily of quartz (SiO2), is one sediment that comes in varying sizes. The
grain size of a material is defined by the diameter of the particle. Cobbles or pebbles or
granules are particles greater than 2 mm in diameter. Sand particles are between 2 mm and
1/16 mm. Silt particles are between 1/16 mm and 1/256 mm. Muds and clays are all less than
1/256 mm in diameter.
class. Sand, made primarily of quartz (SiO2), is one sediment that comes in varying sizes. The
grain size of a material is defined by the diameter of the particle. Cobbles or pebbles or
granules are particles greater than 2 mm in diameter. Sand particles are between 2 mm and
1/16 mm. Silt particles are between 1/16 mm and 1/256 mm. Muds and clays are all less than
1/256 mm in diameter.
Silt and clay are the most abundant of all sediment sizes. They make up mud. Mud turns into shale. Shale accounts for almost half of the known sedimentary rocks. Sand is the second most common grain size and also accounts for a large percentage of all sedimentary rocks. Coarser sediments make up a small fraction of all sedimentary rocks.
The process of turning sediment into rock is called "lithification." Sedimentary rocks are called "sedimentary" because they are made of "lithified" sediments. The sediments in sedimentary rocks are "cemented" together. (This is a good common sense question--How do the sediments stay together? A lot of people think they are merely smashed together.) The lithification process helps the cementation process along. Common cementing agents in nature are calcite, silica, and iron oxides. Or, in our case, glue! What is holding the grains on the comparator cards together? What happens when naturally occurring cements are removed from the rock?
Some people may be familiar with the terms "clastic sedimentary rocks," "chemical sedimentary rocks," and "organic sedimentary rocks." Clastic rocks formed when sediments became cemented together and compacted into solid rock. They are classified by the size of the sediments from which they are composed. For example, sandstone is made of sand, siltstone of silt, claystone of clay. This exploratory session focused on clastic sedimentary rocks. In case someone asks, limestone is a chemical sedimentary rock (although some consider very fossilifierous limestones to be biochemical). Organic sedimentary rocks form from decaying organic material. Coal is a good example of an organic sedimentary rock.
Week 3: September 24, 1997 - EARTH PROCESSES
Exploratory Activity: Use an assortment of supplied items to discover characteristics
of the various mineral and rock samples which may provide you with general ways to classify and identify
unknown specimens.
Key points to be gained from the exploratory activity:
Televised Content Broadcast: EARTH PROCESSES
Weekly assignment: What IGOs did tonight's topic address?
Background information:
A mineral:
Is a pearl a mineral? (No--it is organic.) Is water a mineral? (When frozen, it meets all of the above criteria.) Is gold a mineral? (It is an element which rarely has a crystalline structure.) Every mineral has a definite chemical composition. Since silicon and oxygen are so abundant in the earth's crust, a great majority of minerals are silicates. (What is a common silicate mineral?--quartz, SiO2). The earth's crust contains more than 2000 minerals. A few are very common. (You have 14 of them in the flow chart exploratory activity.) About 95% of the earth's crust is made up of silicate minerals. Of these silicates, about 60% are feldspars and 12% are quartz.
One way minerals are classified is by chemical structure. Thus there are silicates (the most common and abundant minerals), sulphides, oxides, halides, carbonates, etc. (What is a well-known carbonate mineral?--calcite, CaCO3; What is a well-known sulphide mineral?--pyrite, FeS2.) It is important to mention that the chemical structure of minerals often contains other elements. These elements can significantly influence other properties, such as color, of the mineral.
Another way of classifying minerals is by their crystal structure. Many terms exist to describe the multitude of ways in which atoms and/or ions may be arranged. You will hear Dr. Bob talk about "sheet silicates." The tetrahedron crystalline structure of the layered minerals (such as micas) provide them with unique and interesting characteristics--such as their distinctive one-directional cleavage. (Look at the pyrite. What crystal structure grouping might you suspect it falls under?--cubic.)
Most minerals can be identified by using a combination of observations which include the following:
Minerals combine to make rocks. Rocks are classified into three main groups: igneous (rocks formed from the cooling of magma and/or lava), sedimentary (rocks formed from sediment grains which have been transported, deposited, and then cemented together), and metamorphic (preexisting rocks that have been changed by combinations of heat and pressure generated by deep burial, tectonics, hydrothermal processes, etc). All rocks can be changed from one type into the other through the "rock cycle."
Igneous rocks are classified by color (light or dark as determined by the minerals in the rock), and texture (grain size determined by the rate at which the rock cools). Lava is molten rock on the surface. Magma is molten rock beneath the surface. (Given two bodies of molten rock, one on the surface and the other beneath the surface, how would their cooling rates differ? An underground body cools more slowly. How might the differences in cooling rates influence the texture of the rocks which form from these two bodies? The size of the crystals in the surface body are smaller because it would cool faster.) Extrusive igneous rocks form from lava on the surface. Because the lava cools quickly, mineral crystals have little time to grow. Therefore, the cooled, solid rock has small mineral crystals in it. These small crystals produce a fine-grained texture. (An extrusive igneous rock is most commonly thought of coming from what? A volcano. What is a good example of an extrusive igneous rock? Yes, lava--but more specifically basalt, obsidian, rhyolite.) "Intrusive" igneous rocks have larger grains because the magma (being underground) cools more slowly allowing for development of larger mineral crystals. (What is a common intrusive igneous rock?-- granite.) Relate color and texture to the igneous identification chart used in the exploratory activity.
Sedimentary rocks are classified by the grain sizes and how the fragments are cemented together. This was discussed last week.
Metamorphic rocks are classified as either foliated (visible layering or bands), or non-foliated (rocks with no visible layering). Foliation gives us one of the most widely misused terms in West Virginia geology--slate. We have no slate in West Virginia--our thinly layered rock is the sedimentary rock shale. It is composed of the clay-sized particles seen during the exploratory activity last week. Metamorphic rocks can indicate the degree to which they have undergone change. Increasing heat and pressure (don't forget that pressure and temperature are related) will produce the following sequence: slate, phyllite, schist, gneiss. Important misconception--rocks undergoing metamorphism do not melt and reform. Gneiss may become plastic but it is not a fluid.
Week 4: October 1, 1997 - WEST VIRGINIA GEOLOGY
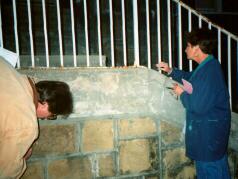
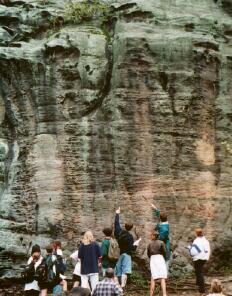
Application Phase of Previous Exploratory Sessions: Local Field Trip
This session serves as the application portion of the learning cycle model for the concepts
covered in weeks 1, 2, and 3. Observations and interpretations utilize the grain size
comparator, mineral and rock identification charts, etc. This will be accomplished through
facilitator-led site field trips which:
 Embedded Facilitator Assessment: During the field experience, participants should
demonstrate:
Embedded Facilitator Assessment: During the field experience, participants should
demonstrate:
Example of an informative and acceptable weekly IGO review
| Topic | Grade Level | ||
|---|---|---|---|
| 1. Particle size composition | 5.24, 5.25, 5.27 | 6.24, 6.25, 6.36 | 7.24, 7.25 |
| 2. Clay negatively charged | 5.25, 5.28 | 6.24, 6.25 | 7.24, 7.25, 7.38, 7.39 |
| 3. Current volcanic activity | 5.24 | 6.24, 6.63, 6.67, 6.68 | 7.24 |
| 4. Yellow River | 5.24 | 6.24, 6.63, 6.70 | 7.24, 7.61, 7.62 |
| 5. Flocculation | 5.24 | 6.24 | 7.24, 7.38, 7.39 |
| 6. Types of sand here | 5.24 | 6.24, 6.48 | 7.24, 7.67 |
| 7. Weight of particles | 5.24 | 6.24 | 7.24 |
| 8. Cohesiveness | 5.24 | 6.24, 6.36 | 7.24 |
| 9. Velocity & diameter relationships | 5.30, 5.40, 5.42 | 6.24, 6.48, 6.50, 6.54 | 7.24, 7.49, 7.55 |
| 10. Velocity & grain size relationships | 5.30, 5.40, 5.42 | 6.24, 6.36, 6.50, 6.54 | 7.24, 7.49, 7.55 |
| 11. Samples: spot vs. channel | 5.46, 5.50 | 6.24, 6.36, 6.42, 6.48, 6.69 | 7.24, 7.66 |
| 12. Particle arrangement: random vs. preferred | 5.31, 5.50, 5.51 | 6.24, 6.36, 6.48 | 7.24, 7.66 |
Background information:
Week 5: October 8, 1997 - WEATHERING AND EROSION
Weathering and erosion are important concepts. While most everyone calls West Virginia the "Mountain State," geologically it is more appropriate to call it the "Valley State." This is because much of our hilly terrain has been formed not from the building of high area but by the subtraction of material in low areas. As water, wind, and ice work on the rocks, they break them down into ever smaller pieces. In West Virginia, most of these pieces are carried away by streams and rivers. Eventually, this process carves the valleys we now see between the higher peaks, ridges, and mountains.
INCORRECT MYTH--West Virginia's mountains and valleys were carved by glaciers. This is absolutely wrong!!!!! At no time did the glacial ice lay over what is now the state of West Virginia. In fact, the best evidence indicates that the closest the ice ever got to West Virginia was 8 miles north of Chester in the extreme northern panhandle.
A few new terms were used in class last week. Let's make sure we know what they mean!
Weathering - the breakdown of exposed rocks or the breaking apart of rock into smaller pieces. This breakdown can be accomplished by mechanical weathering or chemical weathering.
Erosion - the actual moving of the weathered rock by wind, ice, or water. As soon as a rock is weathered, erosion begins to carry away the newly formed sediment. This sediment is ultimately deposited someplace else. Given time and the proper conditions, newly deposited sediments will become a sedimentary rock. Weathering and erosion are commonly used as synonyms but really are complimentary processes.
Relief - the difference between the region's highest and lowest points. For example, West Virginia's statewide relief would be determined by subtracting the elevation of Harpers Ferry from the elevation of Spruce Knob. Local relief can vary. The amount of relief in the southern part of the State may be in excess of 2,000 feet. In the northern part of the State it is about 500 feet. Do not confuse relief with elevation above sea level! Many plateaus are thousands of feet above sea level but relatively flat. Relief can be geologically related to rock type, stream patterns, and the amount of deformation (folding) the rocks have undergone.
Anticline - formed when sedimentary rocks are deformed into an upward arching pattern. In nontechnical terms the rocks look like a "frown."
Syncline - the opposite of an anticline. The rock layers are deformed into a downward arching pattern. Synclines look like "smiles!"
Trellis pattern - the erosional pattern made by streams carving their way through highly folded bedrock. In the eastern part of West Virginia, the folded rocks have a tendency to produce linear ridges and valleys occasionally connected by water gaps. This type of pattern is called a "trellis drainage pattern." Trellis drainage occurs when sedimentary rocks of differing resistances to weathering and erosion are highly folded. The streams carve their way through the less resistant rocks (like shale and limestone) more easily, creating long linear valleys. Over time, as the local relief increases due to stream erosion, the more resistant rocks (like sandstone) appear to form linear ridges.
Dendritic - in contrast, the rocks of the western two-thirds of the State are basically flat lying. In this case, the differences between less-resistant and more-resistant rocks do not have the same amount of control. Think of it like this--because the layers are flat (like a table top), the stream flows over the same layer of rock for a larger area. Therefore, it really has no preferred flow direction. This produces a more haphazard stream pattern which produces knobs (instead of long ridges) and broader valleys. Exceptions can be found in southern West Virginia. The sequence of rocks in the southern part of the State contains a large amount of thick and resistant sandstones. As the streams cut their way through these sandstones, the can not have the wide floodplains seen in the northern part of the State. As a result, the local relief can become quite impressive. The New River Gorge is a prime example.
Some ideas for teaching weathering and erosion:
Week 6: October 15, 1997 - TOPOGRAPHIC AND GEOLOGIC MAPS
Various kinds, types, and styles of topographic maps are used by earth scientists. For example, a 7.5-minute quadrangle map (so called because it shows 7.5 minutes of latitude and longitude) can be purchased as an ortho-photo map (a photograph), a topographic map showing just contour lines, or a topographic map showing forested areas in green (called "green sheets" by some). You will also hear professionals refer to "quads" and "topos." This is the commonly used slang version of "quadrangle" and "topographic." In either case, the individual is referring to a topographic map of some kind.
It is also critical to remember that maps of any kind come in different scales. Scales are important to interpreting the amount of detail shown by the map. For example, if you compare a map with a scale of 1:24,000, you will see that it shows a lot more detail than a map with a scale of 1:100,000. You will also see that the 1:24,000 map shows a lot less area. Thus, understanding differences in scale can help you pick out the best map for your own uses.
In class you were provided with the opportunity to see many different kinds of maps and maps of different scales. After you had the chance to review these maps, you should have moved on to a series of exploratories. Your work should have allowed you to develop a clear understanding of these maps, their uses, what the various symbols represent and how to use them in a classroom situation. If you are still puzzled by them, you should phone or e-mail me for assistance.
Introduction to topographic maps. You should understand:
Week 9: November 5, 1997 - PLATE TECTONICS, VOLCANOES, EARTHQUAKES, AND
MINERALIZATION
The telecast portion of the evening is scheduled to be a discussion of plate tectonics. The major types of plate collisions were mentioned earlier in the semester. This concept will be connected to volcanoes, earthquakes, subduction zones, rift valleys, sea-floor spreading, etc. This latter point--sea-floor spreading--and the notion of continental drift will be discussed.
Mineralization and the role of carbon tetrahedrons in sheet silicates will also be mentioned. This will come up because so many of the common rocks are silicates. Remind participants that the Bowen's reaction series allows one to determine the sequence of rocks formed from a cooling mass of magma. The connection between plate tectonics, subduction, volcanoes, etc. brings the formation of new rocks into play. This is a great point to connect chemistry and earth science.
Sea-floor spreading can be envisioned as a conveyer belt (a lousy analogy but appropriate for the beginner) of molten rock being forced to the surface along a linear fracture zone in the earth's crust. A good example of this is the Mid-Atlantic ridge. The actual motion itself is identified through the analysis of the magnetic characteristics of the rocks themselves. As the earth's magnetic field flip-flopped during the last 200 million years (the amount of time since the Atlantic Ocean started to open), it has produced a characteristic pattern of alternatingly magnetically-oriented rocks. Since the magnetic orientation is preserved as the molten rocks cools, it provides geologists with evidence that the sea floor must have been expanding (if the sea floor was produced in one swoop, it's magnetic orientation would be the same everywhere).
Some of you may have seen the PBS nature show on turtles of the South Atlantic. Scientists have wondered for years why these turtles swim the 1,500 miles from a small mid-Atlantic island to lay their eggs along the South American coast. Recently, someone suggested that plate tectonics could be the simple answer to this phenomenon. The turtles have been forced to swim further and further away because, over geologic time, their ancestral breeding grounds have moved away from their home island. Interesting to contemplate!!!
The difference between plate tectonics and continental drift is important. Plate tectonics is the mechanism driving the movement of the plates which results in movement of the continents, i.e., continental drift. Remember, the plates are usually of much different size and dimension than the continents. For example, the North American plate carries a large portion of the North American continent but also half of the Atlantic Ocean!
By the way, Pangaea was not the first, nor will it be the last, great landmass to form through plate movement. Many geologists think that at least two and maybe four "Pangaeas" existed in the distant geologic past. The idea of Pangaea also allows you to bring oceanography and meteorology into play. Try to get some ideas from them about how a single landmass effected ocean and air currents. How might climates have been altered? A quick look connection to biological and paleontological evidence will reveal that biological and faunal diversity contain important clues about plate movement and continental drift. When the continents were together, plants and animals could migrate easily into what are now separate continents. Ever wonder how some dinosaurs got around?
Many of our students are older than the theory of plate tectonics. While the idea of continental drift has been around longer, it was ridiculed because there was no mechanism to explain how solid rock continents moved. Plate tectonics only took hold as an accepted working theory in the 1960s. The geology text books I used in college in the early 1970s briefly mentioned it as a new idea for explaining continental drift and mountain building. Before that, mountain building was kind of a magic, black box theory--rocks build up in a certain areas and then, ta da, mountains formed. Plate tectonics has done much to legitimize the earth sciences as real science.
Class notes provided by Ed Berry, a facilitator at the Parkersburg, WV, site.
Two key lines of evidence for sea-floor spreading: First, reversed magnetism of iron minerals in matching sequences of either side of the Mid-Atlantic ridge. Key mineral used to determine paleomagnetism is magnetite. Magnetite grains are small and widely dispersed in magma. This allows the magnetite to align to the north as they crystallize. The earth's magnetic field is due to differences between the inner and outer core (different density, state of matter, and speed of movement). Reversal of the magnetic field has taken place at irregular intervals over geologic time. The last reversal dated at approximately 780,000 years before present. The reason for reversal of poles is not presently known. Second, matching ages of rocks on either side of the Mid-Atlantic ridge. Youngest rocks are near the ridge with rocks progressively older as you move away from ridge.
Divergent Plate Boundaries ( ) = plates moving away ) = plates moving away
| ||
|---|---|---|
| EXAMPLE | TRAITS | |
O:O | Mid-Atlantic Ridge | Upwelling magma Sea-floor spreading Volcanoes Earthquakes |
C:C | Rifting in East Africa | Rift valleys Volcanoes Earthquakes |
Convergent Plate Boundaries ( ) = plates colliding ) = plates colliding
| ||
| EXAMPLE | TRAITS | |
O:O | Aleutian Islands | Volcanic island arc Subduction zone Ocean trenches Deep earthquake |
O:O | West Coast of South America with Andes Mountains | Subduction zone Ocean trenches Volcanoes Mountain range on continent |
C:C | Himalaya Mountains | Deep earthquake Deformed rock Mountain ranges |
Transform Fault ( ) = plates sliding past each other ) = plates sliding past each other
| ||
| EXAMPLE | TRAITS | |
O:O | Mid-Ocean Ridge | Offset spreading centers Transform faults |
C:C | San Andreas Fault | Deformed rock Lateral faults |
Plate tectonics driven by convection currents within mantle. The Wilson Cycle postulates a recurring cycle of plate tectonics every 500 million years. However evidence of such a cycle only dates back to about 1.1 billion years ago. Older rocks metamorphosed or melted and recrystallized, preventing further evidence for Wilson Cycles.
Age of oldest dated rock is 3.98 billion years. These are highly metamorphosed, so they must have been in existence at least 4.6 billion years ago.
West Virginia Rocks: Oldest are the 1.1 billion-year old rocks of the West Virginia basement and are know as Grenville rocks. Grenville rocks cover a large portion of the eastern U.S. and adjacent Canada. Grenville rocks are metamorphic, which indicates a collision at least 1.1 billion years ago similar to North American-African continental collision which produced Appalachian mountains about 220 million years ago. Thus, there is evidence for Paleozoic landmasses and possibly prior Pangaeas.
West Virginia has evidence of Taconic and Acadian orogenies in form of massive sediment loads washed into West Virginia. Sediments yielded thick shale deposits--the Martinsburg of Ordovician age and the Devonian black shales.
Deformation of rocks due to plate tectonics can either result in brittle deformation resulting in faults or in plastic deformation resulting in folded rocks, or a combination of the two.
The Alleghenian orogeny resulted in intense folding and faulting in eastern West Virginia with less folding as one moves west. Deep thrust faults have displaced rocks many miles westward. Temperature and pressures of continental collision resulted in metamorphism in Blue Ridge (seen at Harpers Ferry, WV) and granite intrusions to the east of West Virginia.
Differential erosion of folded rock in West Virginia's eastern panhandle and Allegheny mountains shows the following: ridges capped by tough sandstones while valleys eroded from weak shales and soluble carbonates.
Rifting of North American-African landmass resulted in rift basins (rift valleys) to the east of West Virginia. These basins are filled with Triassic and Jurassic sediments.
Three factors which determine characteristics of magma: temperature, pressure (which boosts melting point), and water content (which depresses melting point). Basaltic magma has a melting point of 1,100 - 1,200oC while granitic magma has a melting point of 600 - 700oC.
Week 10: November 12, 1997 - Stratigraphy, Geologic Time, and Paleontology
Stratigraphy is the study of rock sequences and how they can be
interpreted to reveal past geologic events. In West Virginia, stratigraphy
is mostly confined to the interpretation of depositional events
related to the transport and accumulation of sediments which
eventually became the sandstones, limestones, shales, and coals
 common in the State. You may hear sandstones, siltstones, and
shales called "clastic" sedimentary rocks. This is a term
indicating a rock composed of transported sediments. Remember,
the faster the wind or water velocity, the larger the size of
grains that can be moved. This is an important concept for
beginners to remember when trying to figure out environments
where shale (mud in still water) and sandstone (different-sized
sand grains, depending on the water/wind velocity) form.
common in the State. You may hear sandstones, siltstones, and
shales called "clastic" sedimentary rocks. This is a term
indicating a rock composed of transported sediments. Remember,
the faster the wind or water velocity, the larger the size of
grains that can be moved. This is an important concept for
beginners to remember when trying to figure out environments
where shale (mud in still water) and sandstone (different-sized
sand grains, depending on the water/wind velocity) form.
This is a great time to bring the old adage, "The present is the key to the past," back to the participants' attention. Remind them that geologists interpret the past by assuming that the natural processes at work today were also at work in the geologic past. Often a student asks about the rate at which things happened in the geologic past. It is important to admit that things probably did happen today as they did back then but the rate of occurrence is highly variable. And in reality, the clues in the rock record are vital to figuring out these occurrences. This process allows earth scientists to determine the last volcanic event in an area, the most recent tsunami, etc. Unfortunately, the rate of these events is not the same. Thus, proposing realistic models of geologic events requires a combination of useful data and professional inspiration.
The rate at which events occur or occurred in the past can be described as episodic but not periodic. Basically this means an event may repeat itself but not in any determinable or definable time frame. For example, seismic activity along the San Andreas is episodic--there is no doubt there will be another large earthquake. However, these earthquakes are not predictable in time.
Another important point here is the role plant and animal fossils play in the interpretation of ancient environments. (You may hear these ancient environments referred to as "paleogeography.") Stratigraphic sense of a sequence of rocks often is revealed by a close look at the fossils found in one or two layers. These fossils permit the geologist to "correlate" rocks from one area of a state, or even the world, to another. At the basic level, plant fossils indicate a terrestrial environment while animal fossils may be indicative of a wide variety of environments.
The Ames Marine Zone of northern West Virginia was formed during the Pennsylvanian period. Thus it, and the fossils it contains, are about 300 million years old. It contains many different kinds of animal fossils. This unit is sometimes called the Ames Limestone. In reality, the limestone portion of the Ames seems to be less than continuous. A geologist might refer to it as "laterally discontinuous" or "nodular." Thus, in some locations there is limestone while in others there is almost none. So how do we know it is the same rock unit? Because of the fossils! An "index fossil," characteristic of the unit, can be traced around the area. The index fossil indicates that the rock sediment forming the rock in Wellsburg was deposited, for our purposes, at the same time as the sediments that make up the rock in Morgantown.
So, what does the difference in the amount of limestone mean? The Morgantown locations where your samples come from are somewhat limestone deficient. Here, it is mostly a shale with limestone nodules. The limestone probably indicates a slightly deeper and cleaner water while the shale probably reveals areas where some fine-grained clastic materials were being flushed into a shallow, relatively calm body of water (it had to be calm to let the fine-grained particles fall out of suspension). And, if you think about it, this muddy water was probably not the optimal condition for animal life. Thus, instead of large brachiopods, we find small ones--and not a lot of diversity. This is another connect to the life sciences--a discussion of conditions that control plant and animal diversity.
Fossils are not always uniformly scattered throughout any rock. They are often concentrated in different layers. Also, the abundance and type of fossils may change laterally over either short or long distances. These lateral changes are often the key to figuring out the paleo-environments over large areas. You may hear these lateral changes referred to as "facies changes."
Vertical and lateral changes in fossil concentrations and types indicate changes in environments. Changes in environments mean optimum life conditions for certain species or unhealthy environments for others. A common (abundant) fossil found at most Ames locations is Neochonetes (Neo-co-nee-tees). Taxonomic evidence indicates this animal preferred full saltwater conditions. Thus, the Ames is interpreted to be representative of an area near an ocean shoreline. Gastropods are not necessarily good paleo-environmental indicators because they exist in so many different environments.
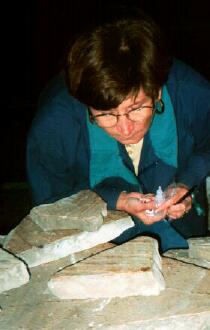
It is not necessary to tell students exactly what they are looking for when exploring for fossils. The trick to finding fossils is identifying something that looks different from the surrounding matrix. Small lines, round shapes, swirls, etc. should start to be seen the longer they look. And, the more they look, the more chances they have of finding something. As soon as one person finds what they think is a fossil, they bring it to the attention of the instructor and others. This sharing reinforces student interest in what they should be looking for. This can go on for 10 to 15 minutes. Yes, some students become disgruntled and say they have no fossils. Encourage them to look harder.
After 10 to 15 minutes or so, hand out an identification key. Have them place their "finds" directly on the picture of the animal it represents. You can check their accuracy during a quick walk around.
Make sure you tell participants that the idea of fossils is an obvious connection to biology, zoology, and anatomy. For example, the tie-in to ideas such as classification (phylum, class, species, etc.) is obvious.
Fossil hunts can be extended into classroom sessions by doing counts. Ask each student, or group, to do a count of their discoveries. For the purpose of this class, only count the total number of brachiopods, crinoids, pelecypods, gastropods, etc. Make a bar graph visually demonstrating the distribution. This graph should show the total numerical occurrence of each type of fossil.
This works even better as a comparison if you collect fossils from two or more different outcrops of the same geologic unit. Use the graphs as a basis for a discussion on the relationship between the distribution of certain fossils and the possible type of paleo-environment which dominated the area. Is there any evidence for a change in the distribution of fossils between sites? There may or may not be a noticeable difference. If the graphs are similar you should lead them to conclude that the two sites had similar conditions. If the graphs are visually different, they should interpret this to mean the sites had different conditions supporting different animal communities. While this is hard to visualize for many, tell them to think of a present-day shoreline. Within five miles of the beach, entirely different communities of animals can be found.
The Ames Marine Zone is found in rocks of Pennsylvanian age. These rocks are about 300 million years old. What does the fossil evidence reveal about the geography and environment of the Morgantown area during the Pennsylvanian period? The area was under seawater at the time. This was not a permanent situation. Below the Ames is the Harlem coal bed representing a swamp. Above the Ames is Grafton Sandstone representing a non-marine river system. Hence, starting at the bottom, the swamp represents an area of quiet water with abundant terrestrial plant life. As the swamp was drowned by rising sea level (or subsidence of the land), marine waters, with their animal communities, covered the area which used to be the swamp. At some point, sea level dropped, or the land rose, causing the sea to retreat from the area. As the seashore retreated, a river was established to carry runoff to the sea. This non-marine river carried a lot of sand. The sand was formed from the weathering and erosion of some older sandstone, probably located someplace near the head waters of the old river. Thus, this evidence points to a higher, inland, maybe even hilly terrain. Some of this sand was deposited and lithified (cemented) into the sandstone we now call the Grafton Sandstone. And, even though each of these events are related, they represent slightly younger events. How do we know this? Because one is stacked on top of the other and the oldest rocks, and hence the oldest environment, are found on the bottom. The whole sequence from the bottom of the coal to the top of the sandstone probably represented 100,000 years or so at most. Think about it!
The vertical sequence tells a story of repetitive changes in sea level or land height! The sea we are referring to was not the Atlantic but an inland sea located to the west and northwest of West Virginia. Hence, when sea-level change went up, the water invaded from the west and north.
Week 11: November 19, 1997 - OCEANS AND OCEAN FLOORS; CLIMATE AND WEATHER
Clarification of a question heard during the exploratory session last week: the water depth for the Ames sites was very shallow. Think of the Florida coast or Florida Keys. In many places the total geographic relief for an island may be measured in tens of feet (or less) above sea level. Similarly, they have gently sloping, very broad beaches leading into very shallow, semi-calm waters covering submerged shelves extending long distances offshore. It is quite possible that the water depth for the Ames was between zero (the shoreline) and a few tens of feet (probably less than 30). Also, the sea, in Ames time, was to the west and north. Therefore, when the shoreline was at Morgantown, the water to the north and west (like near Wellsburg) had to be slightly deeper--but not much, maybe only a foot or so. Many geologists routinely use the terms "marine," "fresh," or "brackish" when describing environments occupied by various invertebrates. However, many have reached the point where they now use only "marine" or "non-marine." This has developed from studies indicating brackish waters, and the animals they support, cover a wide spectrum of salinities.
The topics for this week deal with weather, climate, oceans, and the ocean floor. The basic ideas of density, heat transfer, and movement are critical to oceanographic and meteorological concepts. The ocean floor discussion will focus on physical features such as seamounts, guyots, tsunamis, etc.
Our shoebox exploratory activity has holes punched at every grid
intersection on the box top. This assumes the student will
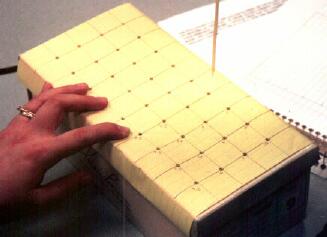 determine depth to the simulated surface by probing every hole.
Thus, the student is given a predetermined search grid. This
often happens in real life. However, you may wish to change this
to emulate tactics mimicking a true "wildcat" operation exploring
a totally unknown area. This type of research involves several
steps. First, all of the available literature data (sounds
familiar, huh!) is reviewed. Based on this data, a reconnaissance
exploration is suggested. This usually involves the drilling of
the first hole or a few widely-spaced holes. In the case of the
ocean floor determinations, this may be limited to a few broad
sonar sweeps. Newly acquired data is reviewed. New exploration
plans, focused to maximize time and money without sacrificing
efficiency, are suggested. These new plans often propose more
closely spaced drilling, or closely spaced sonar runs, within a
limited area. Thus, more details about a promising area are
obtained. Of course, this requires ignoring other, seemingly less
interesting, areas. As you can see, interpretations evolve, or
are abandoned altogether, as the amount of obtained information
increases.
determine depth to the simulated surface by probing every hole.
Thus, the student is given a predetermined search grid. This
often happens in real life. However, you may wish to change this
to emulate tactics mimicking a true "wildcat" operation exploring
a totally unknown area. This type of research involves several
steps. First, all of the available literature data (sounds
familiar, huh!) is reviewed. Based on this data, a reconnaissance
exploration is suggested. This usually involves the drilling of
the first hole or a few widely-spaced holes. In the case of the
ocean floor determinations, this may be limited to a few broad
sonar sweeps. Newly acquired data is reviewed. New exploration
plans, focused to maximize time and money without sacrificing
efficiency, are suggested. These new plans often propose more
closely spaced drilling, or closely spaced sonar runs, within a
limited area. Thus, more details about a promising area are
obtained. Of course, this requires ignoring other, seemingly less
interesting, areas. As you can see, interpretations evolve, or
are abandoned altogether, as the amount of obtained information
increases.
After each participant (or team if you want) have formed some
sort of simulated sea floor in the box and sealed it, they should
 trade the box with another participant or team. Their assignment
is to figure out the shape of the landform inside the box. An
extension of this idea provides participants with play money to
purchase "probing rights." Each probe might cost a fixed amount
of money. How efficiently, and cheaply, can you be in comfortably
identifying the inside of the box?
trade the box with another participant or team. Their assignment
is to figure out the shape of the landform inside the box. An
extension of this idea provides participants with play money to
purchase "probing rights." Each probe might cost a fixed amount
of money. How efficiently, and cheaply, can you be in comfortably
identifying the inside of the box?
Once sealed, do not let participants open the box. It is important they (and their students) understand that a scientist often never knows if he/she is right or wrong. The best that is possible is an interpretation based on the available data. And, different interpretations of the data often lead to conflicting theories or ideas. So don't avoid disagreement over what's inside the shoebox. Encourage it and stimulate them to think of ways for resolving the dispute (without removing the lid!).
The following class notes were supplied by Ed Berry, a facilitator at the Parkersburg, WV, downlink site.
Referring to last week's discussion, some biologists are replacing kingdom monera with two different kingdoms--the archebacteria which includes extremophiles (discussed last week) and eubacteria (the more familiar bacteria of decay, sore throats, etc.).
Comparing Oceans and Continents: oceans = 71% earth surface; continents = 29% earth surface. Oceans = extreme depth 11 km off Guam, average depth 3.7 km. Continents = extreme elevation Mt. Everest at over 9.0 km, average elevation 0.8 km. If the continental shelf, composed largely of continental rock, is considered part of the continent, then percentages of ocean versus continent are really more like 60% versus 40%. Which means that 11% of continents are presently under the sea.
Changing Sea Level: In the geologic past much greater portions of continents were under water. Sea level has fluctuated greatly over geologic time. These fluctuations can be explained by geologic processes. Glacial episodes greatly alter sea level rapidly (in geologic terms). Upwelling of magma in oceanic rift zones and settling of ocean basins alter sea level more slowly than glacial events.
Mapping the Sea Floor: Attempts to measure depth by Magellan resulted in "unmeasurable depth." Early idea was that sea floor was flat. First ocean floor maps by 1850s. WWI and WWII resulted in technology for sea-floor mapping. Present technology of side-scanning radar yields accurate maps.
Miscellaneous: Deep plain covered by silica ooze from rain of dead plankton. CaCO3 dissolves at these depths, pressures, and temperature. Continental rock mostly granitics with density of 2.7 g/cm3. Continental shelf with canyons carved during lower sea level. These canyons still being carved by debris flows. Oldest continental rock is 3.96 billion years before present. Oldest oceanic rock is 200 million years before present. Atlantic basin still expanding. Youngest oceanic rock near spreading centers at mid-ocean ridge/rift.
Continental drift proposed by Alfred Wegener in 1920s. Wegener offered evidence (matching rock sequences, fossils, etc.). Wegener's idea rejected because no driving mechanism was known at that time. The matching coastlines of South America and Africa were noted by early mapmakers.
Hawaii and Hot Spots: Hawaii around one million years old. Islands are progressively older westward. One line of evidence for this is weathering and erosion process--the westward islands are visibly more weathered and eroded. Volcanoes extinct except for Hawaii. Age of Midway Island is about 27 million years before present. The seamounts farthest west are about 60 million years before present. Some of these older volcanoes have actually sunk as they have cooled. This is a good chance to use density as a connecting link to other sciences.
Climate and Weather: Climate closely tied to interaction of heat budget of seas and atmosphere.
In northern hemisphere, high pressure systems rotate clockwise while low pressure systems rotate counterclockwise. Opposite rotation is found in the southern hemisphere.
Cold fronts are relatively fast moving and usually submarine under warm fronts. This causes rapid upwelling of air which generates a lot of energy, like thunderstorms. This air cools and releases its water quickly and sporadically over relatively small areas.
Warm fronts are relatively slow moving. As they override cooler air masses, the warm air slowly rises over a large area. This slow cooling of the warm air generates less energy and causes general precipitation over a larger area.
Check USA Today or Weather Channel web sites for updates on location of fronts, pressure systems, jet stream, etc.
Must not forget to relate climate change in geologic past to fluctuations in solar strength, plate tectonic movements, etc.
Week 12: December 3, 1997 - THE SUN, MOON, PLANETS, AND STARS
Weather permitting, you will be taking your participants outside to view planets visible in the western and southwestern sky. You may wish to go out and familiarize yourself with possible views and the position of the planets themselves. Although a dark area with a flat horizon is preferable, do not panic over the presence of a few bright lights and buildings. Just try to find a spot where you can see the moon fairly well.
It is important for you to realize that this view is for 6:45 pm!!! You must get outside as soon as possible--some of the planets are low on the horizon and will be difficult to see if you wait until 7:30! Do not worry about locating the planets. Enclosed you will find copies of star maps plainly showing their location. The map is centered on the moon. I think we can all find that one!!! So, use it as your guide to finding the planets. The constellations in the area do not contain any bright stars. (By the way, I always picture Sagittarius as a big teapot.)
Can't see the provided guide sheet because it's dark? Suggestion: make a shoebox planetarium to take outside to show them what's what! (The directions for constructing this handy item can be found farther down on this page.) Question: What is the difference between starlight (emitted by the body) versus planet light (reflected by the body)? Some people say that the stars twinkle while the planets do not. Problem is the light has to travel through the same atmosphere so any air disturbances would seem like they should bother both! At some point, face the crowd, hold up your shoebox, place the flashlight inside, and turn it on. Your participants should see only the light shining through the holes and the holes will help them locate the planets. Use your hidden key to tell them which planet is which.
One way to improve the shoebox is to cut and tape a sheet of overhead acetate to the inside of the shoebox bottom. Using some transparent marking pens, put a spot of color over each hole. Then, tape a legend inside which lets you know that the red spot is Mars, the blue is Venus, etc. When you shine your flashlight into the box, the students will see various colored dots. By not coloring over the hole for the moon, it will appear white. Using this scheme you can easily direct the participants' attention to a specific planet by merely asking them to find the one you're showing in, for example, red. Did they see them all? Why/why not? Maybe too low on the horizon, moon to bright, or a building is in the way, or need bigger binoculars. If someone says the planet is too low of a magnitude to see, stop them right there! Stars have magnitudes--both visible (how bright it looks is partially based on its distance from us) and absolute (how bright it really is). Planets possess albedo. Albedo is the ability of an object to reflect light. Question: All things being equal, why is Venus so bright? Because its cloud cover reflects a great deal of light--therefore it has a really high albedo. Why are Neptune and Uranus not as bright--they have a lot of clouds and high albedos also? Farther away so the light we receive is less. Look at Mars. Why does it look reddish? (Reflects a lot of red light from its red surface.)
Seen the planets--now what? Look at the moon. Notice the craters and the larger dark areas. These darker areas are called mare (Latin for sea). They were given the name because early observers thought them to be bodies of water. The name really isn't all that bad because they may represent large flows of magma. Geologically the moon is dead. This would mean that these lava flows happened a long time ago.
Notice the patterning of the craters. Is there anyway to date the relative age of the impacts? Sure--just like rocks, the oldest impact is on the bottom. In this case, the locations where one crater rim overlies another provides visible evidence of the sequencing of the impacts. Most astronomers think that cratering was much more common until about a billion years ago. Question: Why? Speculation is that meteors were much more common in the geologic past. Over time, they have literally been swept from the solar system as they collided with larger bodies. Question: Why don't we have such visible evidence of impacts on Earth? Weathering quickly removes the impact scars. You may make a suggestion for a relative age dating impact activity for students. Enclosed is a copy of an activity that Hobe King started working on many years ago. It needs some polish but provides a beginning on how to approach impact evidence as the basis for an exploratory activity. You may wish to run through a portion of the activity, time permitting, during the exploratory time to make sure they are comfortable with it and to elicit comments for improving the activity itself. (I'd appreciate new ideas!)
When looking at the moon, notice the shadowing. The best time to observe the moon is during quarter to half phases. (Phases can also be discussed. And for those who think gravity is underappreciated, bring up the fact that the moon is primarily responsible for ocean tides!!) Notice any shadowing on the moon? Question: Why is this shadowing important to observers? During a full moon, there is very little shadowing. Therefore, features do not stand out well. During other phases, the shadows really highlight the relief between crater rims and crater floors. (Trivia: What is the shadow line across the face of the moon called? The terminator--a way cool tie-in to a popular adolescent movie!)
Use the binoculars to observe Jupiter. You should be able to see the four Galilean moons (these are, in increasing distance from Jupiter: Io, Europa, Ganymede, and Callisto). Question: Why is Io so important? Io had the volcanic eruption that was photographed by Voyager II in 1979. This was the first evidence of geologic action on another world. These moons are collectively called the Galilean, named for Galileo by the way, because Jupiter was one of the first objects he looked at with his telescope. His observations of the moon's motions around Jupiter provided him with the evidence he needed to support Copernicus' idea of a heliotropic (sun-centered) solar system. By the way, Galileo did not invent the telescope. Dutch ship captains had been using them for a decade or so before Galileo turned his on the night sky! And the reason he became famous is because he recorded and published his observations, not to mention his little problem with the religious community! Suggestions: students can do nightly observations of the positions of Jupiter's moon using only small binoculars. These observations can really demonstrate the moon's changing positions and lead to discussions of orbits, revolution, gravity, etc.
While outside, you might suggest that student observation of planetary motion over a three to four week period can be another great way to introduce them to looking at the sky. All that is needed is a fixed landmark like a tree, house, etc. The student needs to look at the sky from the same location at the same time for a series of evenings. A record of each observation would be a labeled sketch of each night's position of bright stars and visible planets. At the end of the three to four weeks, the student should be able to understand that the stars seem like fixed objects while the planets do not. In fact, the term planet means "wandering star." This can lead to discussion on distance, size, speed, motion, etc.
Enclosed in your packet are copies of the sky showing the location of the planets visible during the night of December 3, 1997. Make sure each participant receives a copy of this handout. Ask them to carefully look over the data provided at the bottom of the page. Note how the observer's longitude and latitude and the time of day are given. Also note the other coordinate system mentioned--right ascension (the astronomer's longitude) and declination (the astronomer's latitude). Therefore, every object in the night sky can be located using a grid system (shown on the map) very similar to longitude and latitude. The map also shows two other important lines. Question: Notice how the planets seem to cluster along the dashed line running through the constellations of Capricorn and Sagittarius? This is the ecliptic. The ecliptic is the area of space where the planets are also found. Question: What constellations straddle the ecliptic? Those of the zodiac! Two other dashed lines are shown. One is the horizon--you probably won't see anything below this line. The other, near the constellation Aquila, is the celestial equator. Close observation of the map will show that the planets you are actually at have southern celestial sphere values! Only in winter can you see this!!
Magnitude is also shown on the handout. Notice there are no bright stars in this part of the sky. Also notice that magnitude numbers work bass ackward. The lower the number, the brighter the star. Venus is probably around a -2 or -4 depending on your viewing conditions.
Students of all ages have a problem explaining seasons. Enclosed is a copy of an activity used by RockCamper Deb Ennis of Wheeling Park High. Make sure everyone gets a copy.
The time, if any remains, has come for your participants to use their shoeboxes to make something. They have their choice of making a shoebox planetarium or a pinhole solar observatory.
If you still have time, have them construct an adding-machine tape solar system scale. They will need measuring devices (English, or metric for the English challenged!!!), adding-machine tape, and calculators. Ask them to experiment with different scales so they can get a feel for room sizes needed to accommodate really big scales. I have done this activity by setting up the endpoints (Sun and Pluto) of the scale in a hallway, and asking seven students (one for each remaining planet) to stand at a spot in the hall where they think the planet they represent would be found. Of course, I never let anyone be Pluto because they would be outside someplace--although I remember many students eager to assume such a role! After placing themselves, I ask them why they went there, what their justification was, etc. This is all done before any discussion of the solar system takes place. After rearranging them, I provide each with a little card to read. The card has some basic planet information on it. In the classroom, you can always refer to "Remember where Janey and Johnny were standing?" That's how far apart so-and-so are!
Class notes from Ed Berry, a facilitator at the Parkersburg site.
The sky observation scheduled for class was canceled by rain. The night before (Tuesday, December 2, 1997) the sky was dark and clear. This incident was used to point out the nature of earth science observations--sometimes Mother Nature does not cooperate!! In spite of the bad weather, participants were encouraged to try to see the planet "swarm" which will continue, in some form, through most of December. From our vantage point, Venus, Mars, Jupiter, Saturn, Uranus, and Neptune were all visible shortly after dusk. This alignment will not be seen again this century. Get out and see it.
Tonight's inclement weather was used as a connection back to last week's topic. In winter, low pressure areas dominant our area. As a result, we see rapidly moving fronts. This produces dramatic changes in daily and weekly weather. In summer, high pressure systems are predominant, resulting in slow moving systems. These systems produce weather which is more stable over several days or weeks.
In place of the outside observations, some sites used provided data to construct a Hertzsprung-Russel (H-R) diagram. Astronomers use these graphs to integrate star temperature, absolute magnitude, star color, and size. The plot visually shows that most stars fall along a line called the "Main Sequence." Our sun is one such main sequence star. Stars with distinctive colors, sizes, and/or temperatures plot off of the main sequence. The conclusion the students came to was that these stars must be very different than our sun. Non-main sequence stars are the giant stars, dwarf stars, etc.
The numerous literary sources for astronomy data and references were discussed. It was also noted that the Internet is rich with astronomy sources. All of NASA's photography, including the late images from the Hubbell telescope, are available and can be downloaded and printed.
Some recent developments in astronomy were mentioned briefly:
Europa, a moon of Jupiter, is believed to have liquid water beneath its frozen surface. Astronomers speculate that extremophiles might survive there. Io, a moon of Jupiter, has shown the first visible evidence for active volcanism outside of earth. The spectacular comet hits on Jupiter in 1994 were discussed. Discovery of possible fossils (bacteria) in a meteorite from Mars and its occurrence in Antarctica, and why it is possible to tell it came from Mars were discussed. Fossils are microscopic and resemble similar fossils found on earth, although it has not been definitively shown that these are indeed from once living organisms. That the meteorite is Martian in origin is well documented. Proof of origin includes: similar mineral content of meteorite and known Martian minerals, similar percentages of oxygen isotopes to known Martian minerals, chemical composition of gas pockets within the meteorite matches Mars atmosphere. This meteorite was blasted off by another meteorite impact on the surface of Mars 18 million years before present. It landed in Antarctica approximately 13,000 years ago.
This led to a discussion of Meteor Crater in Arizona. It is one mile across and 60 stories deep. Privately owned and now a popular tourist site, it was once explored as a possible iron mine.
Types of Meteorites: Metallic are composed of iron and nickel (hence the above search for iron to mine). Stony meteorites are composed of silicate minerals (rocks). Chondrites are stony meteorites with carbon present.
A question about evidence for impact cratering on earth was raised. Why does the moon show hundreds of crater impacts but the earth (of a similar age) shows few impact scars? The answer is the earth is geologically active. Plate tectonics, weathering, erosion, and deposition have reworked the surface of the earth. This activity has obliterated or obscured most crater impacts. Only geologically "dead" areas routinely show impact scars. Such areas are found in the Precambrian shields of Canada, Russia, and Australia.
It should be noted that the number of meteors was much greater in the early stages our earth. It is theorized that, during their formative stages, the planets' gravitational attraction essentially captured many of the small drifting pieces of material. This led to a brief discussion of the asteroid belt. Two theories prevail--a terrestrial planet formed and exploded or the material never coalesced to form a planet. It was also noted that meteors are often associated with the earth's passage through cometary tails.
Week 13: December 10, 1997 - UNTIL WE MEET AGAIN!
Last live broadcast!
The first part of the show will be Deb discussing educational possibilities at Greenbank. They have a new program which appears to be close to receiving funding. She will also mention RockCamp briefly. Dr. Bob will finish up some odds and ends from last week.
To provide more feedback on the exams, Dr. Bob will spend part of the telecast reviewing both the mid-term and the last test.
We will be back in the Fall of 1998. We have been listening to your comments. Classes will be offered for a letter grade instead of "S/U." We will have a formal textbook as a reference. Ways to connect earth science to biology, chemistry, and physics will be suggested but we will not go into them in great detail.
A new format will reduce the amount of weeknight traveling. Both pre-taped and live telecasts will be offered. Earth science is a little different from the other sciences--our primary laboratory is the out-of-doors. So, we want to bring you to the lab! This will be accomplished through a series of Saturday sessions. These regional sessions will provide larger time blocks for exploratory sessions and field trips. Opportunities for face-to-face meetings between instructors and all participants will also be enhanced.
In and of itself, earth science is a coordinated and thematic science course. As such, it is impossible to adequately cover important concepts in an all-inclusive, one-semester course. Our new curriculum plan will enhance teacher understanding of the earth sciences. The Fall 1998 class will concentrate on introductory-level geology only. No prior knowledge of earth science will be assumed. A similarly formatted Spring 1999 course will focus on meteorology, oceanography, and astronomy. The environmental course will be a culminating course using concepts and principles learned in these two introductory courses. It will be offered in the Fall of 1999.
Please give these classes a try. Tell your friends about them. Information about the course will be distributed to classrooms and will be posted on the WVGES web site in February. We will also spend some time talking about the Fall 1998 show.
TAKE-HOME TEST #1 NAME ____________ FALL, 1997
DUE WEDNESDAY, NOVEMBER 5, AT THE BEGINNING OF CLASS
YOU CAN USE ANY BOOKS, MATERIALS, AND VIDEOS, BUT THE WORK IS YOURS, AND YOU ARE NOT TO DISCUSS QUESTIONS WITH OTHERS.
I always encourage the drawing of cartoons...you do not have to be an artist. You may even want to add a picture or two as you complete some questions. I am not after volume here--I love good content briefly but precisely conveyed.
SPECIAL NOTE: ON THIS QUESTION, YOU CAN TEAM UP IF DESIRED AS IT MAY OVERTAX THE OFFICES OR SUPPLIES OF THE NRCS.
Your specific task is to use the county maps provided and relate in general terms the relationship between soil and rock type and physiographic province for your "home" county.(+3)
Identify one specific soil and explain how parent material influences the soil type (+3). Suggest how one could create a geologic map of your county based on surface observations of vegetation types and on the availability of a detailed soils map of the county (+4).
MAKE A COPY OF YOUR TEST TO KEEP IN YOUR FILES. TURN IN THE MASTER COPY TO YOUR FACILITATOR.
THIS IS A TAKE-HOME TEST. THERE IS ONE CORRECT ANSWER FOR EACH QUESTION. NOTES, BOOKS, VIDEOS, ETC. ARE FAIR GAME. USE RENTON'S MATERIAL AS A REFERENCE. YOU ARE NOT TO DISCUSS THIS EXAM WITH ANYONE. GOOD LUCK!
WVGES Education Specialist, Tom Repine (repine@wvgs.wvnet.edu)
Page last revised: December 1997
Please send questions, comments, and/or suggestions to webmaster@wvgs.wvnet.edu
Page created and maintained by:
            West Virginia Geological & Economic Survey
  Address:  Mont Chateau Research Center
            Cheat Lake exit off I-68
            P.O. Box 879
            Morgantown, WV  26507-0879
Telephone:  1-800-WV-GEOLOgy (1-800-984-3656) or 304-594-2331
      FAX:  304-594-2575
    Hours:  8:00 a.m. - 5:00 p.m. EST, Monday - Friday
Permission to reproduce this material is granted if acknowledgment is given
to the West Virginia Geological and Economic Survey.
 [up]
[up] [previous]