4.1 Methods
As the team lead on this task, KGS prepared well-based stratigraphic interpretations within an IHS Petra® software database system.
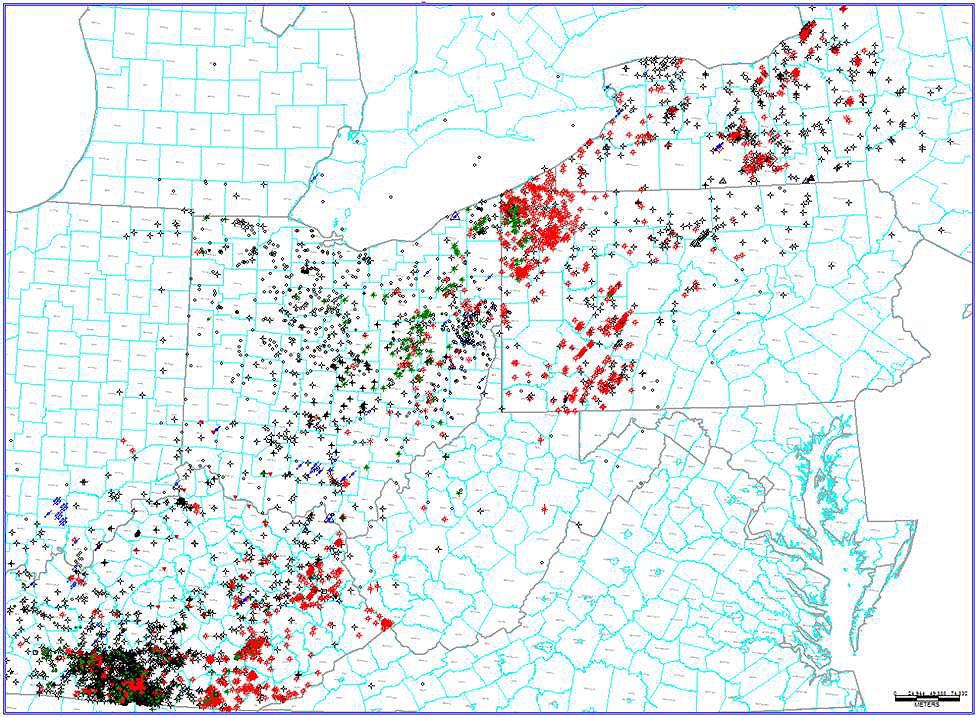
The Petra® project database contains location and header information on 10,416 wells across the five-state Study area and the bordering regions of Indiana, Michigan and southern Ontario,
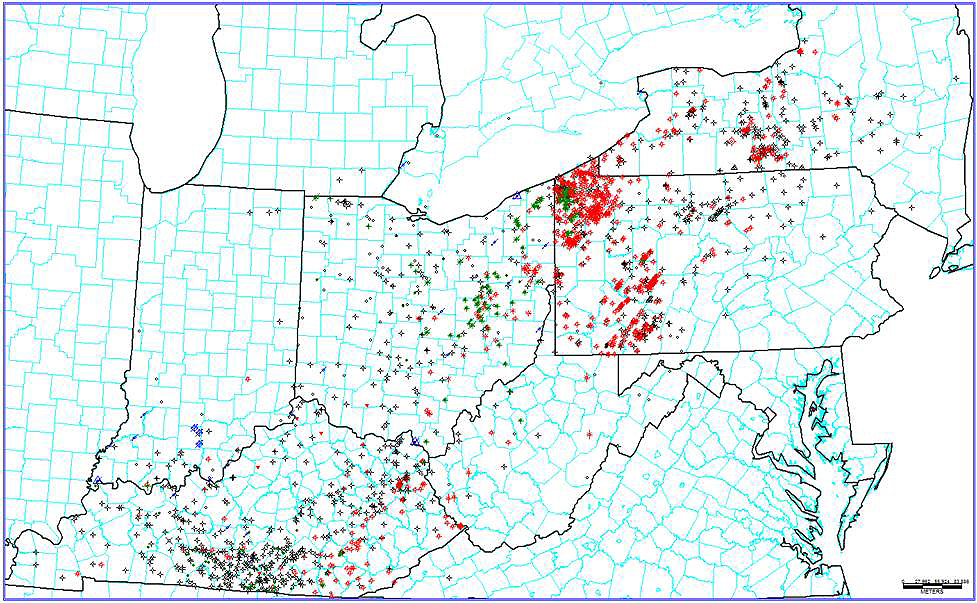
Canada (Figure 4-1), more than 8000 of which are Lexington/Trenton or deeper penetrations. Geophysical well logs have been loaded into the Petra® project for 1978 wells (Figure 4-2).
Of these, the vast majority are from digital Log ASCII Standard (LAS) files, which have facilitated log-based correlations and calculations.

Figure 4-1. Map of 10,416 well locations consulted or otherwise utilized by the Utica Shale Play Book Study.

Figure 4-2. Map of project wells in the Study area with geophysical well logs (1978) loaded into Petra® for mapping purposes.
As part of this Study, KGS extended well-log-based stratigraphic interpretations for the Kope Formation, Utica Shale,
Point Pleasant Formation, upper Lexington/Trenton Formation and Logana and Curdsville members of the Lexington/Trenton Formation (see Figure 3-1) established in the Trenton/Black River project (Patchen and others, 2006).
In addition, KGS researchers studied the Upper Ordovician stratigraphy on outcrops in the Maysville, Kentucky, area in order to better understand depositional and facies characteristics of the Utica and Point Pleasant formations.
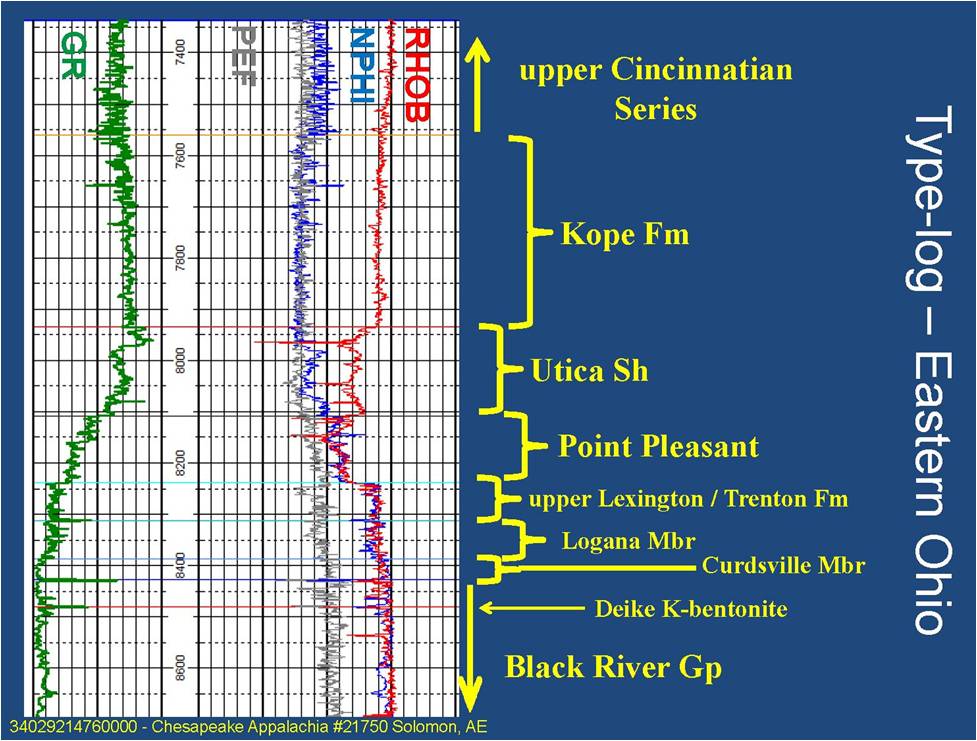
A type-log for the log character of the researched units is presented in Figure 4-3.

Figure 4-3. Geophysical type-log for the researched units in the Study area