(6) Inorganic Chemistry

6.0 Introduction

The research team evaluated the inorganic geochemistry of Utica Shale and equivalent rocks by conducting bulk mineralogy, carbonate content and inorganic carbon isotope testing on rock core and cuttings samples. Bulk mineralogy was determined using XRD and SEM techniques, with the results categorized in three main groupings – quartz plus feldspar, carbonate and clay minerals. Carbonate content was further evaluated using insoluble-residue analysis to determine how relative amounts of carbonate minerals (calcite and dolomite) may vary throughout the Utica interval. Carbon isotope tests were performed to evaluate the chronostratigraphic relationships of Late Ordovician strata across the Study area.

6.1 Bulk Mineralogy

The Consortium website provides access to bulk mineralogy results for more than 1200 samples collected at dozens of well locations throughout the Study area. A majority of these (i.e., 930) were specifically analyzed for the current Study Appendix 6-A pdf icon (PDF, 14.9 MB; 27 pages). The remaining bulk mineralogy data (i.e., 299 samples taken from 78 cores) represent legacy XRD analyses from Ohio, and are not discussed herein.

6.1.1 X-ray Diffraction

6.1.1.1 Materials and Methods

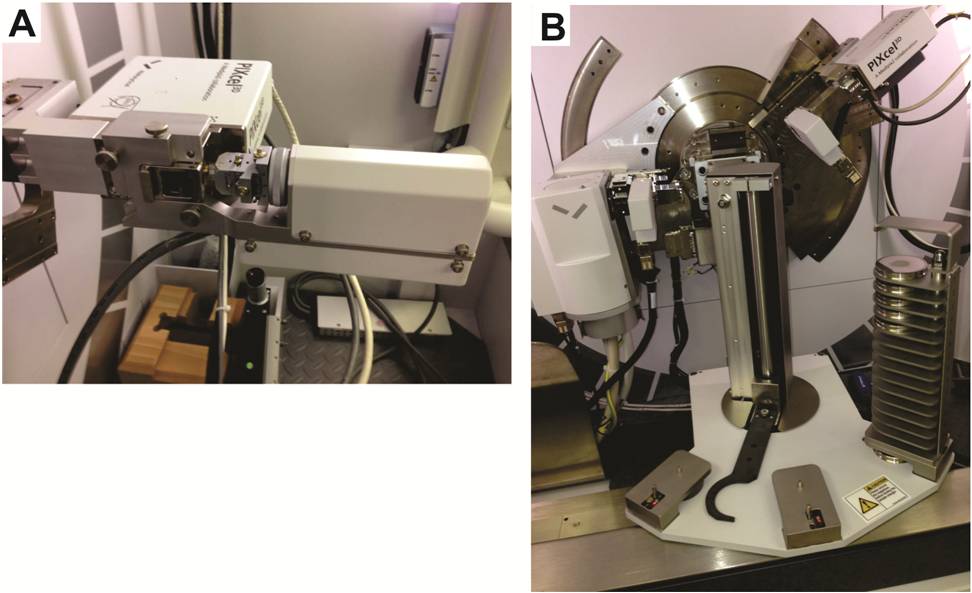
PAGS was the team lead on bulk mineralogy testing performed for the Study. Accordingly, PAGS purchased and installed new XRD equipment for this project in June 2013. The equipment includes a computed tomography (CT) stage (Figure 6-1A) and a multi-sample changer (Figure 6-1B). The multi-sample changer was heavily used by John Barnes, the PAGS geochemist who performed the XRD work between July 2013 and April 2014.

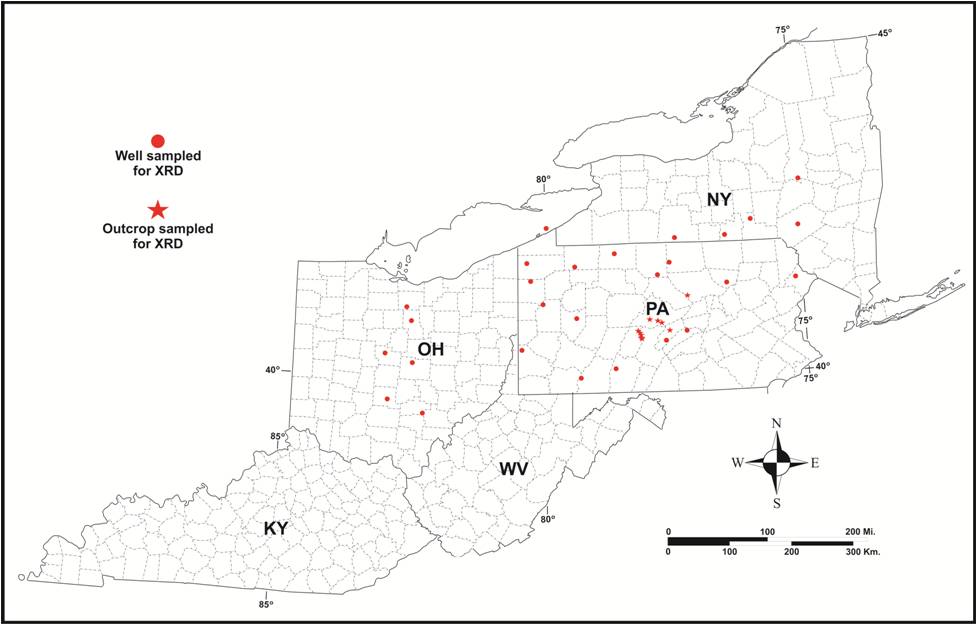
PAGS obtained outcrop samples of Utica-equivalent rocks from 18 outcrops in central Pennsylvania during the field season of 2012. In addition, we collected drill cutting samples from both survey repositories and newer well locations donated by Consortium partners for 28 wells in the Study area, including five wells in New York, six wells in Ohio and 17 wells in Pennsylvania. The locations of the outcrops and wells are shown in Figure 6-2 and additional details are given in Table 6-1.

The mineral compositions of 930 samples representing all 18 outcrops and 28 drill holes were determined using X-ray powder diffraction. The analyses were run using a PANalytical Empyrean X-ray diffractometer. The samples were loaded in 16-mm-diameter back-packed sample holders that were mounted in a sample spinner. The results were interpreted using PANalytical HighScore Plus software and the ICDD PDF-4 database. Replicate analyses of 55 samples, representing both outcrops and drill holes, were run as a test of precision.
Two different methods of calculating semi-quantitative results were attempted before it was determined that one was clearly superior to the other for this set of samples. The initial attempt to obtain semi-quantitative results used the Reference Intensity Ratio (RIR) method. According to this method, quantities of minerals in a mixture are determined by comparing the intensities of each mineral’s most intense diffraction peaks to each other and to the published ratios of their most intense peaks to the most intense peak of the stable mineral corundum (Al2O3). This method can sometimes work for minerals that have relatively consistent simple chemical compositions and molecular structures, such as quartz and calcite. The replicate analyses for this Study, however, clearly showed that it yielded unsatisfactory results because the method is strongly affected by which polytypes of layered silicate minerals (e.g., muscovite) are present. Knowing exactly which polytype of such a mineral is present is very difficult to determine in a timely way for scans of mixtures of minerals, especially in a project that involves hundreds of samples.

Even as this comparative analysis of XRD interpretive methods was being performed, PAGS prepared 24 grain mount thin sections for petrographic analysis in an effort to: (1) better estimate bulk clay mineralogy composition in selected Utica and equivalent samples from Pennsylvania, and (2) investigate whether the RIR method was on the right track in interpreting clay mineralogy percentages. Comparison of the petrographic analyses derived from this sample set with their corresponding XRD mineralogy results indicated that there is no direct correspondence between these approaches. The thin section photomicrographs and data derived from this particular effort are included in Appendix 6-B pdf icon (PDF, 1.25 MB; 8 pages).

A second attempt to obtain semi-quantitative results was made using the Rietveld method, a more sophisticated method that uses the whole X-ray pattern, not just its most intense peaks, to find agreement between observed patterns and the published crystal structure data of the minerals through least-squares analyses. Quantities are then calculated based on these analyses. This method can take into account such factors as preferred orientation and peak shape that can present problems in dealing with layered silicate minerals. The HighScore Plus software enabled the programming of an automated Rietveld procedure that took these factors into account, and that was able to provide a level of precision sufficient for dividing the minerals into the major categories reported herein for classifying the lithologies that were encountered.

API No.StateCountyLocation/Well NameSample Depths (ft)Number
of
Samples
NAPAVariousOutcrops in central PANA18
3100705087NYBroomeRichards No. 17400-794025
3102504214NYDelawareCampbell No. 17400-830019
3104303993NYHerkimerSkranko No. 11550-295026
3110103924NYSteubenOlin No. 19500-10,01020
3110723883NYTiogaBeach No. 110,000-10,70035
3404120253OHDelawareWeed No. 11650-196029
3407323283OHHockingSunday Creek Coal Co. No. 3-S4450-479033
3407720028OHHuronNewmeyer No. 12568-293532
3408926065OHLickingRowe-Grube Unit No. 1-36133300-357027
3412920089OHPickawayClutts George & Sue No. 11590-196037
3413920608OHRichlandJoseph Kruso No. 13210-352029
3700521201PA ArmstrongMartin No. 111,750-12,02030
3700920034PABedfordSchellsburg Unit No. 17300-770040
3701990063PAButlerHockenberry No. 18404-890246
3702720001PACentreLong No. 113,800-14,2502
3703520276PAClintonCommonwealth of PA Tr. 285 No. 114,000-14,50049
3703920007PA CrawfordKardosh No. 15870-628044
3704920049PA EriePA Dept. of Forests & Waters Block 2 No. 13705-409637
3706720001PA JuniataShade Mt. No. 13650-390025
3708333511PA McKeanSay No. 19000-920020
3708520116PAMercerFleck No. 16650-720057
3708720002PA MifflinCommonwealth of PA Tr. 377 No. 15050-535020
3710320003PA PikeCommonwealth of PA Tr. 163 No. C-113,400-13,60018
3711120045PASomersetSvetz No. 115,000-15,17016
3711320002PASullivanDieffenbach No. 295116,050-16,4503
3711720181PATiogaMarshlands No. 211,660-12,13046
3712320150PAWarrenShaw No. 18047-837648
3712522278PAWashingtonStarvaggi No. 110,030-11,01099
Total Samples930
Table 6-1. Location of samples that have undergone XRD analysis.

6.1.1.2 Results

As XRD analyses were interpreted, data were assigned to three categories – quartz plus feldspar, carbonate and clay minerals. PAGS plotted the data for these three categories for all of the wells in which more than three intervals were sampled. The plots reflect changes in mineralogy with depth. Displaying the mineralogy results in this manner facilitates the interpretation (or in many cases, confirmation of past interpretation) of Utica and other formation tops (e.g., Figure 6-3). It should be pointed out, however, that the XRD plots are based on drill cuttings obtained from intervals within each well, and interpretations based on them without reference to geophysical logs of the same intervals may result in inconsistent or inaccurate correlations. A complete set of these data plots, as well as of the data spreadsheets used to develop them, is provided in Appendix 6-A pdf icon (PDF, 14.9 MB; 27 pages).

6.1.2 SEM – Energy-Dispersive Spectroscopy

6.1.2.1 Methods

PAGS used SEM imaging in conjunction with energy-dispersive spectroscopy (EDS) techniques to further evaluate the bulk mineralogy composition of nine rock cuttings samples from three wells in Pennsylvania. The samples were chosen for size (>3 mm in largest diameter) from intervals of these wells determined to contain Utica or Point Pleasant shale. The SEM images and corresponding SEM-EDS analytical data (including graphs, text files and element maps) are included in Appendix 6-C pdf icon (PDF, 17.0 MB; 28 pages).

6.1.2.2 Results

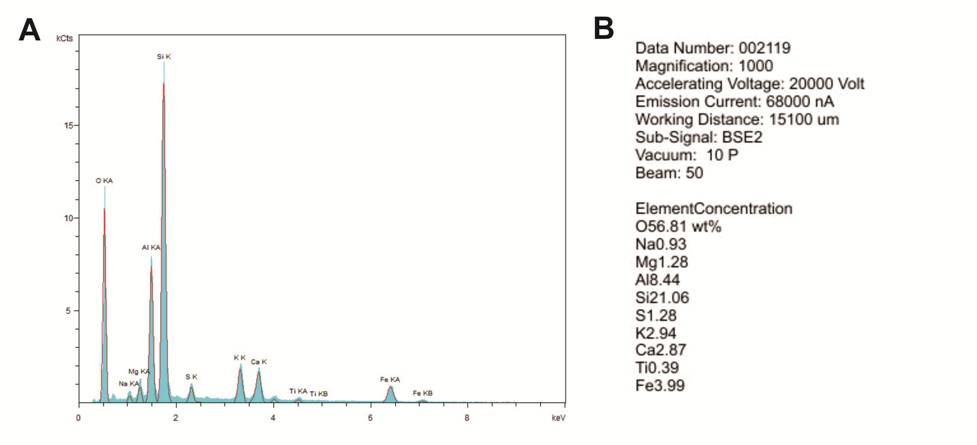
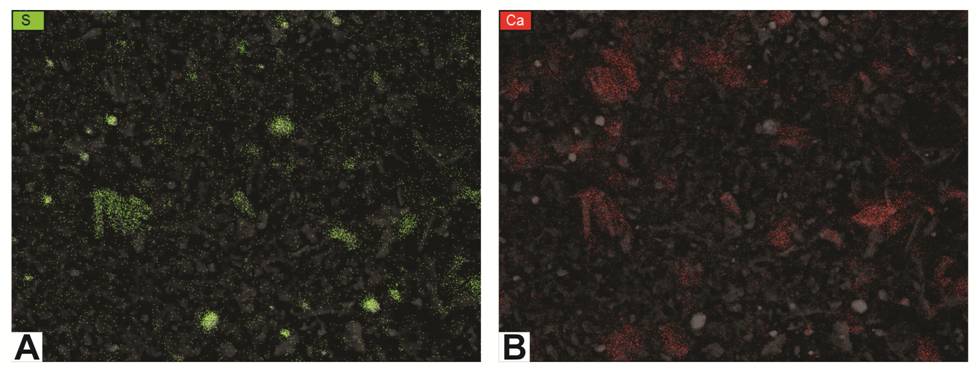
Analytical data for each sample are provided in three parts: (1) a high-resolution image with a nine-digit file name (e.g., S13-013-001) (see, for example, Figure 6-4); (2) an EDS spectrum, which includes a graph and a text file in which the percentages of the elements are listed (Figures 6-5A and B). The percentages represent the entire area shown in the high-resolution image; and (3) a set of element maps showing the image in subdued form overlain with colored dots that show where the element was detected (Figure 6-6). The maps assist with detecting the distribution of minerals. For example, the map for sulfur (Figure 6-6A) shows where pyrite grains exist, whereas the map for calcium (Figure 6-6B) probably indicates the distribution of carbonates (but could also represent plagioclase feldspars). For each sample, there are separate maps for the elements that were detected, including aluminum, calcium, iron, potassium, magnesium, sodium, sulfur, silicon and titanium. Oxygen, although present, was not included because it occurs in nearly every mineral in these samples; a plot of oxygen would be meaningless under the circumstances. Another element that is conspicuously absent is carbon. Carbon is difficult to detect with the instrument used unless it is extremely abundant. In addition, there is a peak for calcium that coincides with the main peak for carbon, making detecting carbon in calcite nearly impossible, even though we know it is there.
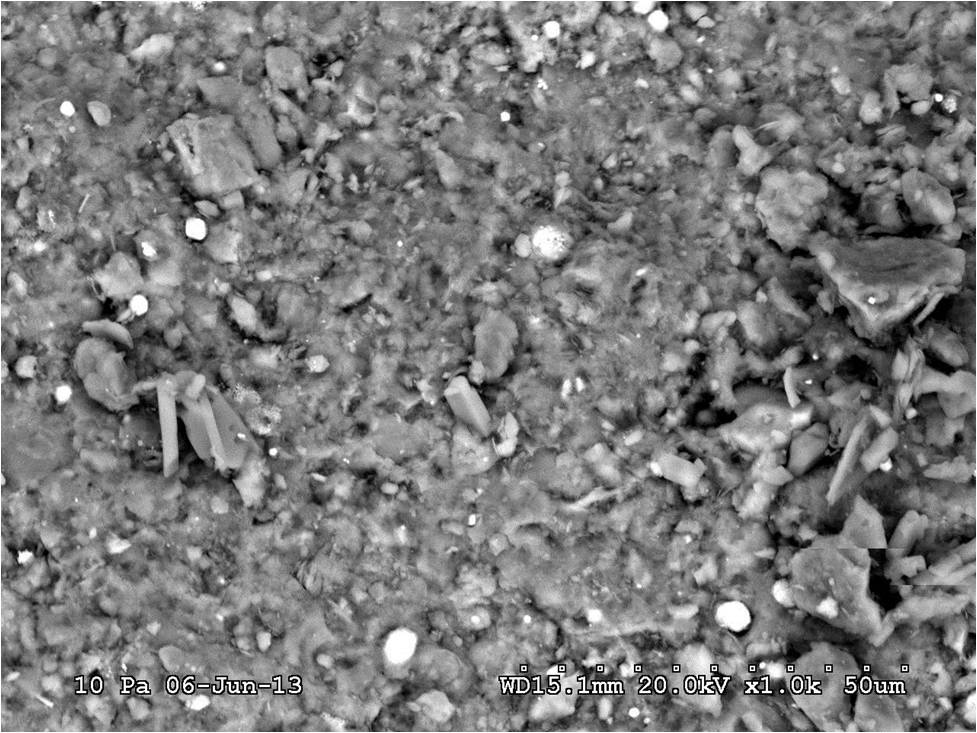
It should be noted that, because these rock fragments do not have perfectly smooth, polished surfaces (i.e., ion milling was not used to process these particular samples), there are places where no element is plotted on the map. Those are areas that were hidden from the detector because of the sample’s rough surface. Further, while most of the elements can easily be correlated with specific grains that are visible in the images, some elements show up only as random dots that are sparsely but evenly scattered across a given sample. This likely represents instrument noise and is not a true representation of the present of an element. This is especially noticeable for magnesium and potassium maps in some of these samples.

PAGS also prepared element maps that illustrate multiple elements in contrasting colors (Figure 6-7). These can be used not only to show the distribution of elements, but also to verify the identity of grains in the SEM photomicrographs. For example, Figures 6-7A and 6-7B provide maps of silicon and calcium in two wells located at opposite ends of Pennsylvania (Butler and Pike counties). It appears that both samples include grains that are high in calcium and basically devoid of silicon, so these grains should be carbonates rather than plagioclase feldspars. The maps also indicate different calcium contents in these samples, which agrees with the XRD analyses from these wells (total carbonate content in the sampled interval of the Butler County well is 6%, whereas total carbonate content in the sampled interval of the Pike County well is 45%).
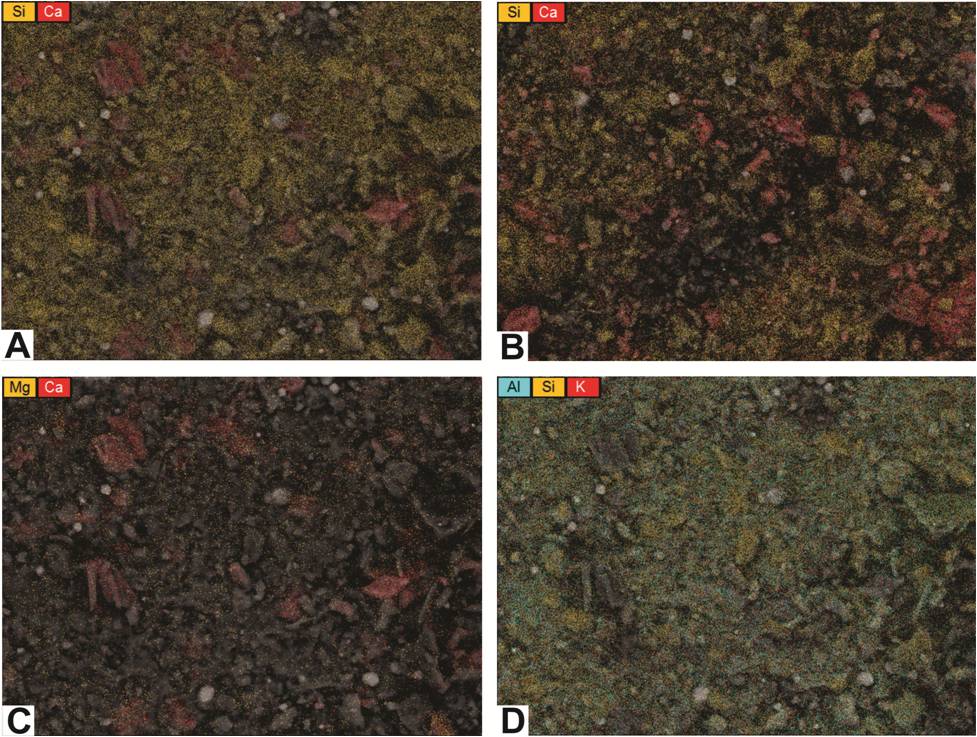
Other element maps can be used to detect different minerals. Figure 6-7C is a map of magnesium and calcium in the same Butler County sample as shown in Figure 6-7A. There is very little magnesium in this sample, so the carbonate grains are most likely calcite rather than dolomite. Figure 6-7D is a three-color map of aluminum, silicon and potassium of this same sample. It shows an abundance of each element scattered across the map, suggesting that the majority of this sample is a potassium aluminum silicate. Although the distribution of these elements could indicate clay minerals, k-feldspar, and/or other silicate minerals, the XRD analysis associated with this sample found no k-feldspar present. Therefore, the XRD results are consistent with the interpretation that the matrix in this particular Butler County sample is most likely comprised of one or more clay minerals (e.g., illite).

6.2 Carbon Content

6.2.1 Methods

NYSM measured rock cuttings and core samples from approximately sixty wells in New York and Ohio for carbonate content using an insoluble-residue analytical procedure. This was accomplished by crushing a sample, weighing the crushed material, acidizing it, putting it in a centrifuge to ensure mixing for three ten-minute periods, drying the sample in an oven and weighing it again. Only the carbonates present (i.e., dolomite and calcite) should be removed by acidizing the sample. The two measured weights for each sample were entered into a formula that is used to calculate the carbonate content. The remaining material (i.e., insoluble residue) would be all non-carbonate constituents – mainly clay with lesser amounts of organic matter, quartz silt and pyrite.

6.2.2 Results and Discussion

When carbonate-content results and TOC measurements were plotted with geophysical logs for a given sample, it became clear that the GR log is mainly driven by carbonate and clay content, rather than TOC content (Figure 6-8). This is unlike the Marcellus Shale play, where GR and TOC track each other very closely. In the Utica Shale and Point Pleasant Formation, the TOC and GR do not track each other for the most part, whereas the carbonate content tracks the GR almost exactly.

Figures 6-9 through 6-12 illustrate crossplots of TOC and carbonate content from four cored wells in Ohio. Core descriptions for these locations can be found in Section 5.2. In the absence of matrix porosity, it may be that the best reservoir is where both the TOC and carbonate content are high. Higher carbonate content might lead to a more brittle and “fracable” rock, while high TOC will provide the organic matter porosity necessary for a productive reservoir. If that is the case, the formations plotting along the upper right on these crossplots would be the best potential reservoirs. Alternatively, it may be that some additional porosity can be found between clay particles and that a slightly higher clay (but not too high) content is best. In that case, formations that plot in the upper center on these crossplots would contain better reservoirs (e.g., see upper Lexington/Trenton Formation, Logana Member and Point Pleasant Formation data points on Figure 6-12).

In general, the organic-rich interval is more carbonate-rich in the basal sections of the Utica and more clay-rich upward. Most or all wells drilled in Ohio are targeting the Point Pleasant, which is the organic- and carbonate-rich portion at the base of the organic-rich interval. In the wells studied, the organic-rich shale in the Utica has an average carbonate content of about 25%. This means that the clay content is probably in the 70% range, which is very high (perhaps too high for the rock to be fraced effectively). The Point Pleasant has an average clay content of approximately 50% within the organic-rich facies, and an even greater percentage in the limestone beds. The upper Lexington/Trenton and Logana members have carbonate content values that average about 70% in their organic-rich facies.

Figure 6-13 shows a correlation from Ohio to New York, and Figure 6-14 zooms in on the organic-rich interval. This correlation was confirmed by carbon isotope data (see Section 6.3 below). The organic-rich intervals are time equivalent to each other. See Figure 3-1 for a correlation of the formation names.

Figure 6-15 shows TOC value and carbonate content plotted against well logs from the Skranko No. 1 in Herkimer County, New York, which was drilled into a deep graben where the Utica Shale is extremely thick. The total thickness of organic-rich strata >1% TOC is more than 1300 ft. Figure 6-16 shows a crossplot of TOC value and carbonate content data from rock cuttings collected from this well. At this location, the most organic-rich interval is clearly in the Point Pleasant Formation, which has higher TOC but a low carbonate percentage between 20 and 60% (averages about 40%). Again, the highest TOC intervals have the lowest carbonate content.

Figure 6-17 shows well logs and vertical plots of TOC and carbonate content from the Lanzilotta No. 1 well in Delaware County, New York. The GR log follows the carbonate content very closely. In the Lanzilotta well, the most organic-rich interval has shifted to the Logana Member, and it appears that even the upper Lexington/Trenton Formation is somewhat organic-rich. The Point Pleasant Formation, however, is not as organic-rich here. Figure 6-18 is a crossplot of TOC value and carbonate content from rock cuttings from the Lanzilotta No. 1 that confirms that the Logana Member is both the most carbonate- and organic-rich, making it the most likely target in this area.

6.3 Carbon Isotopes

Carbon isotopes can be used as a chronostratigraphic tool because the isotopic composition of the marine inorganic carbon reservoir (δ13CDIC) changes synchronously across the ocean over time (see Kump and Arthur, 1999, and Metzger and Fike, 2013, for a detailed discussion). There is little isotopic fractionation during carbonate precipitation so that δ13Ccarb ≈ δ13CDIC. Carbon isotopes are thought to change largely as a function of the global burial flux of organic carbon. The ultimate source of organic carbon produced in the ocean is dissolved inorganic carbon (DIC), and organic carbon is enriched in the lighter isotope, 12C (and therefore has a lower δ13C value). Buried organic carbon means it does not get oxidized back to DIC and is removed from the ocean. Therefore, when organic-carbon burial is high, δ13CDIC will increase because organic carbon is enriched in the lighter isotope, 12C. δ13Ccarb also can change as a result of the isotopic signature of material DIC being delivered to the ocean. This may be important when the source of carbon being delivered to the ocean changes.

The Late Ordovician Black River, Lexington/Trenton, Point Pleasant and Utica formations were all deposited during the final phase of the Taconic Orogeny, which is characterized by high volcanism and the growth of the Taconic foreland basin. In general, organic matter content increases stratigraphically upward from the Black River to the Lexington/Trenton and Utica, and may represent a globally significant increase in organic carbon burial. This is consistent with positive excursions in δ13Ccarb during the study period, but the exact relationship between organic carbon burial and δ13Ccarb requires additional constraints on sedimentation rate. The uplift of carbonates in the Taconic highlands to the east of the Taconic foreland basin also may have increased δ13Ccarb. Future basin history and geochemical work may be able to discriminate between these two mechanisms as a cause of the δ13Ccarb excursions.

6.3.1 Methods

Both core and cuttings samples were collected for carbon isotope testing from locations across the Study area (Figure 6-19). Cores were sampled at state geological surveys using hand drills equipped with 1-2 mm carbide drill bits. Mudstone lithologies were targeted in evenly spaced intervals whenever possible, and veins, fossils, burrows, bedding planes, pyritized zones, tempestites and cement-rich zones were avoided altogether. Rock cuttings were collected by J. Garrecht Metzger, Rachel Folkerts and Davey Jones or collected by, and mailed from, companies and state geological surveys. Cuttings were washed in deionized water, when necessary, to remove drilling mud, and then dried in a 70° Celsius (C) oven for 4-24 hours. Cements, fossils, pyrite, metamorphic minerals (e.g., micas), drill bit fragments and other exotic material (e.g., leaves from drill sites) were removed to the extent possible (removal of all secondary material was not possible for very fine-grained samples).

A fraction of each cuttings sample (<1 gram [g]) was selected for analysis based on lithological properties. As color-specific sampling in New York core 74NY5 demonstrated that darker material extracted from mixed dark and light mudstone lithologies better represented the basinwide δ13C signal (Metzger and others, in press), darker material was isolated in the sampling process whenever possible. Cuttings were crushed using an electric drill equipped with carbide drilling chamber or crushed by hand using a ceramic mortar and pestle.

Carbon and oxygen isotopes were measured on a Thermo Fischer Delta V Plus Isotope Ratio Mass Spectrometer at Washington University in St. Louis. Isotope values are reported in per mil (‰) relative to the Vienna Pee Dee belemnite (VPDB) standard. Isotope values are defined in the following way:

δ13C = (13C/12Cstandard/13C/12Csample – 1) ∗ 1,000 in units of per mil (‰)
δ18O = (18O/16Ostandard/18O/16Osample – 1) ∗ 1,000 in units of per mil (‰)

All runs contained internal standards calibrated to international standards. A typical standard deviation for replicates of δ13Ccarb and δ18Ocarb was ~0.1‰. In total, samples from six cores and 51 wells were analyzed (Table 6-2).

StateWell IDAPITypeTotal #
of Samples
U/Tr
Samples Only
KYC511N/ACore13344
KYT1294N/ACore13724
NY039243110103924Cuttings1111
NY039933104303993Cuttings1NA
NY042143102404214Cuttings22
NY043793102504379Cuttings9NA
NY045473107704547Cuttings22NA
NY095403107309540Cuttings1616
NY095783105309578Cuttings22NA
NY108343107710834Cuttings1111
NY113873101311387Cuttings77NA
NY194853105319485Cuttings166
NY215003102321500Cuttings2727
NY217033110121703Cuttings15287
NY231583101123158Cuttings60
NY235513102923551Cuttings240
NY238293110123829Cuttings2121
OH13653404120109Cuttings54NA
OH15133414120014Cuttings14NA
OH19433407720053Cuttings20NA
OH41353414120042Cuttings26NA
OH41363412727130Cuttings26NA
OH42303416320924Cuttings14NA
OH42453404521156Cuttings29NA
OH51943404521249Cuttings16NA
OH206703402920670Cuttings11837
OH225703403122570Cuttings8345
OH237433411723743Cuttings2714
OH248613416924861Cuttings8026
OH282143411928214Cuttings6527
OHH26263407160009Core16666
OHS25803414760840Core16158
OHW26273416560005Core15654
PA222783712522278Cuttings100NA
PA301383705330138Cuttings75NA
PA900633701990063Cuttings100NA
PA24659 (AKA: EQT 590003)3705924659Cuttings125NA
PAKRDSH3703920007Cuttings8553
PALONG3702720001Cuttings11392
PAN2F3708331744Cuttings9456
PAN9723710520182Cuttings229122
PAORSHK3704920345Cuttings9155
PAPASF3708720002Cuttings140100
PAPIKE3710320003Cuttings2323
PASHLBG3700920034Cuttings8642
PASVETZ3711120045Cuttings1626
PATMPL3708520036Cuttings9867
WVH124702700012Cuttings244106
WVH804702900080Cuttings9356
WVJ13664703501366Cuttings21399
WVK34624703903462Cuttings12175
WVM2444704900244Cuttings14557
WVM5394705100539Cuttings194108
WVM8054705900805Cuttings15136
WVW3514710700351Cuttings8585
WVWCC4710700351Core4830
WVW7564710700756Cuttings14982
 TOTAL38131453
Table 6-2. List of core and cuttings samples analyzed for carbon isotopes.

6.3.2 Results and Discussion

In general, the isotopic intervals of Metzger and others (in press) are identifiable throughout the Study area. Chronostratigraphic correlations were based on δ13Ccarb, and many of these were geographically consistent with GR logs. Therefore, if δ13Ccarb internal boundaries were indistinct in a given well, the corresponding GR logs were used to facilitate correlations. While δ13Ccarb results provide new insights into the chronostratigraphic relationships of Late Ordovician strata across the Study area (for example, Figure 6-20, which is confined to New York), some wells contained noisy, uncorrelateable δ13Ccarb signals. In general, these were found in wells with grainstone lithologies or high cement contents. Figure 6-21 shows an example of close well spacing with a combination of clear and noisy δ13Ccarb signals. This emphasizes that not only should δ13Ccarb records be interpreted in conjunction with other credible data (e.g., core descriptions and geophysical logs) but also that δ13Ccarb should be sampled from multiple locations within a given region in order to provide the most precise results.

Figure 6-20. Chronostratigraphic relationships of Late Ordovician formations in New York (left) with generalized δ13Ccarb intervals and δ13Ccarb chemostratigraphic profiles (right). Stage abbreviations are Whit = Whiterockian, Cinc = Cincinnatian, Sand = Sandbian, D-D = Darriwilian to Dapingian, Tre = Tremadocian. New δ13Ccarb intervals (BR = Black River Group, TR = Lexington/Trenton Formation, UT = Utica Shale) are named for lowest formation in which they were found. GICE = Guttenberg isotopic carbon excursion. "?" next to UT-1 suggests interval is not suitable for correlation (see discussion). δ13Ccarb reference curve with intervals taken from data in this work. Values are in permil (‰) relative to VPDB. Study locations (W1-W7, C1) are shown in their approximate position along the west to east transect. Figure adapted from Metzger and others (in press).
Figure 6-21. Transect of closely spaced wells showing discrepancy in δ13Ccarb records over short distances (green line in Figure 6-19). Well N2F best records isotope intervals while 11387 shows signs of significant alteration in GICE (yellow) and BR-3 (green), while well ORSHK shows moderate alteration. Solid red line indicates the top of the Lexington/Trenton Formation. Wavy red line indicates the Knox unconformity.

Figure 6-22 shows a transect across West Virginia, illustrating the shifting sediment depocenter during Ordovician time. Here, the locus of sedimentation shifts from the west during the Black River (purple, red and green intervals) to the east during the early part of the Guttenberg excursion (yellow interval), and back to the west in the upper Guttenberg excursion and interval TR-1 (blue). Because the duration of the Guttenberg excursion is ~500,000 years the sedimentation shift takes place over the course of a few hundred thousand years. This transition is sufficiently rapid that a simple tectonic explanation is difficult to construct. The bi-directional movement (west then back east) adds to the complication. It may be that the change in sedimentation is a response to changing eustatic sea level caused by ice formation or a combination of tectonics and ice. While no direct geologic evidence for ice accumulation in the Ordovician exists prior to the Late Katian, there is geochemical evidence that suggests ice may have been present around the time of the Black River-Trenton transition (Finnegan and others, 2011).

Figure 6-22. Transect across West Virginia and Pennsylvania (blue line in Figure 6-19). Solid red line is the top of Lexington/Trenton, wavy red line is the Knox unconformity. Base of GICE is always found at the top of Black River. Note changing depocenter from west during Black River time, east during the lower GICE, and back to west in the upper GICE, and TR-1. Correlation picks within the GICE are based on peak δ13Ccarb values (lower black line within yellow interval) and falling limb of excursion where δ13Ccarb = 2‰ (upper black line in yellow interval). Transect is flattened on top of GICE excursion. WVDR is an outcrop from Young and others (2005). This outcrop is not thrust-thickened, despite being in the fold and thrust belt, which suggests that at least some of the thick sections seen in the fold and thrust belt are original thicknesses.
Figure 6-23. Transect across New York and Pennsylvania (black line in Figure 6-19). Relationship between TOC and δ13Ccarb, where TOC is most often highest in TR-1 (blue) and TR-2 (orange). This is thought to show the time dependence of organic-rich rocks, rather than a specific lithology that traps migrating hydrocarbons. TR-1 includes transitional units between the Lexington/Trenton and Utica Shale.

The remainder of this section presents isopach maps (Figures 6-24 through 6-31) based on the δ13Ccarb intervals of Metzger and others (in press). In general, they illustrate a shift in depocenter from West Virginia during Black River time, to New York during the GICE and TR-1 when faulting is initiated in New York, and then onto the carbonate platform in Ohio during TR-2. This could be due to rising sea level from the uppermost GICE interval and above where the sedimentation locus moved shoreward during transgression.

Clearly correlatable δ13Ccarb signals were captured in all study areas, and δ13Ccarb intervals are largely equivalent to those observed in New York (Metzger and others, in press). Signal clarity was lower in cement-rich grainstone lithologies and in areas with low sampling resolution (relative to sedimentation rate). In general, the most organic-rich strata were found in δ13Ccarb intervals TR-1 and TR-2, with the former being the most organic-rich of all the δ13Ccarb intervals. Interval TR-1 is found in the strata transitional between the argillaceous carbonates of the Lexington/Trenton Formation and black shales of the Utica and Point Pleasant formations.