(4) Subsurface Mapping and Correlations Through Geophysical Log Analysis
Download:
Abstract and Citation  (PDF, 297 KB) ⋄
This Section (PDF, 14.9 MB)
4.1 Methods
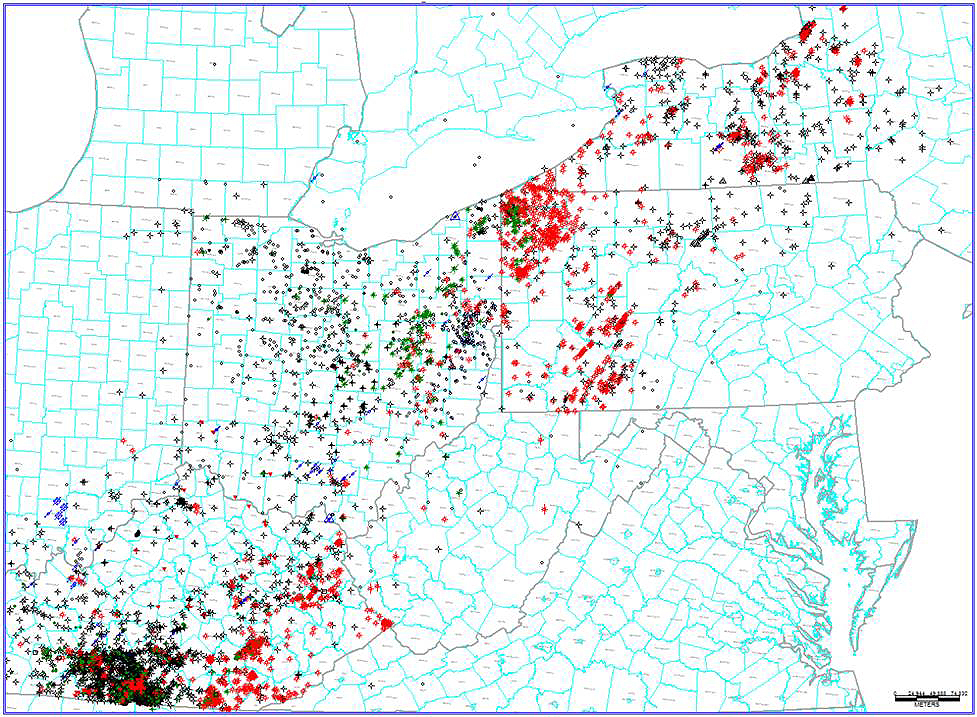
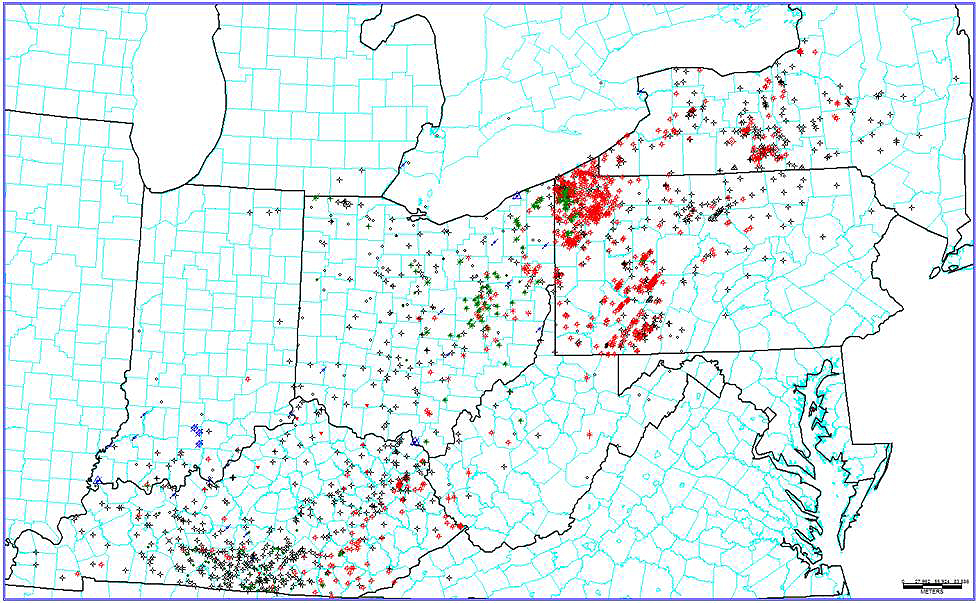
As the team lead on this task, KGS prepared well-based stratigraphic interpretations within an IHS Petra® software database system. The Petra® project database contains location and header information on 10,416 wells across the five-state Study area and the bordering regions of Indiana, Michigan and southern Ontario, Canada (Figure 4-1), more than 8000 of which are Lexington/Trenton or deeper penetrations. Geophysical well logs have been loaded into the Petra® project for 1978 wells (Figure 4-2). Of these, the vast majority are from digital Log ASCII Standard (LAS) files, which have facilitated log-based correlations and calculations.
As part of this Study, KGS extended well-log-based stratigraphic interpretations for the Kope Formation, Utica Shale, Point Pleasant Formation, upper Lexington/Trenton Formation and Logana and Curdsville members of the Lexington/Trenton Formation (see Figure 3-1) established in the Trenton/Black River project (Patchen and others, 2006). In addition, KGS researchers studied the Upper Ordovician stratigraphy on outcrops in the Maysville, Kentucky, area in order to better understand depositional and facies characteristics of the Utica and Point Pleasant formations. A type-log for the log character of the researched units is presented in Figure 4-3.
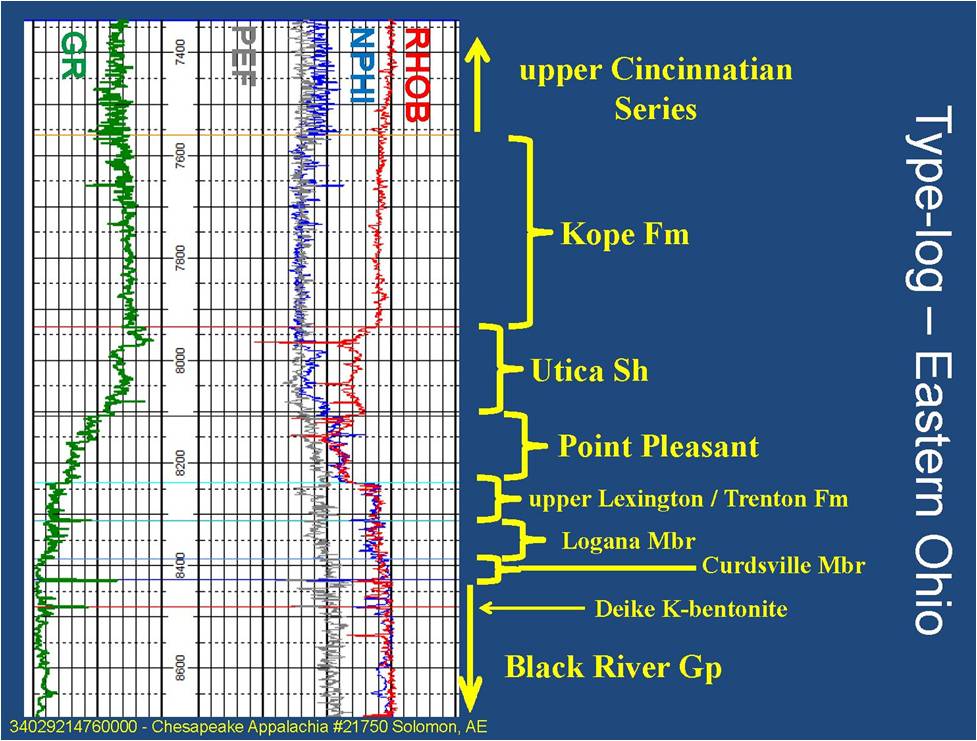
Figure 4-3. Geophysical type-log for the researched units in the Study area
4.2 Results
The following maps (Figures 4-4 through 4-16) illustrate the results of the stratigraphic correlations for this Study, including both structure and annotated isopach maps. All structure maps display elevations in ft relative to mean sea level (MSL), with bold red lines representing major fault zones that were active in the Ordovician (Patchen and others, 2006).


Figure 4-5. Isopach map of the Kope Formation. Thickness in ft with a 25-ft contour interval.


Figure 4-7. Isopach map of the Utica Shale. Thickness in ft with a 20-ft contour interval.


In addition to interpreting traditional stratigraphic tops from geophysical well logs, we have interpreted Upper Ordovician stratigraphy for three continuous cores from Kentucky (Figure 4-18). To aid in interpretation, the Upper Ordovician intervals of two of these (C-209 in Montgomery County and C-316 in Pulaski County) were photographed wet, in 10-ft intervals (Figure 4-19).

